Author
The Netherlands has almost 4,000 km of dykes. Over the past decades, a significant amount of clay has been used within these dykes for reinforcement. This layer of clay is essential as water barrier and to prevent the construction from collapsing due to erosion. Clay of the right quality is becoming less and less available, particularly because the usage requires a minimum thickness of 1.0 to 2.0 metres. Therefore, alternative materials such as Trisoplast are being researched as a suitable replacement for clay.

What is Trisoplast?

Trisoplast is a highly impermeable material comprised of a specialised clay-polymer component combined with a mineral filler such as sand, which is particularly suitable for this purpose. Developed by Tritech Solutions, which has been extensively applying this material since 1996 (Berg, 2016), Trisoplast was initially developed and successfully used for more than 30 years to seal off the top and bottom of landfills, therefore preventing the leaching of substances into the ground. Moreover, Trisoplast is also used for:

  • pond sealing;
  • sealing of tank pits, industrial areas, sheet pile wall pits; and
  • making underground structures such as canals watertight.

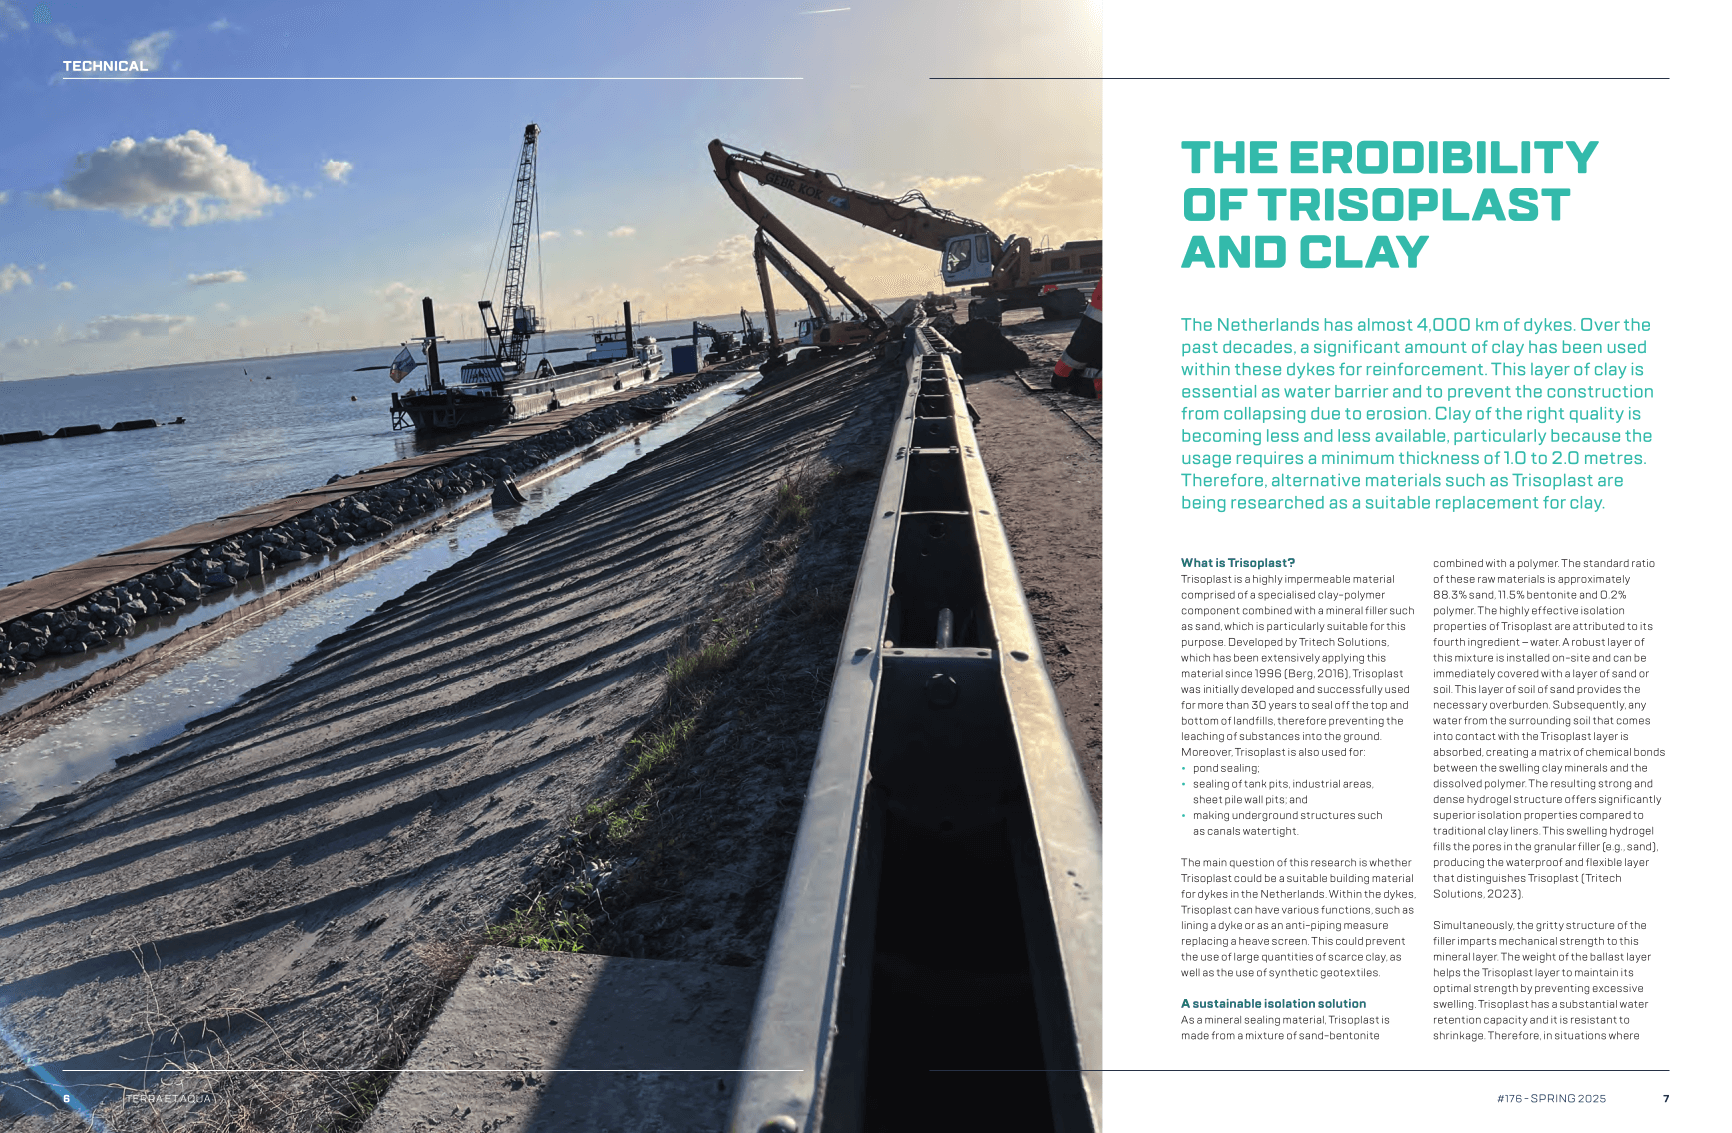
The main question of this research is whether Trisoplast could be a suitable building material for dykes in the Netherlands. Within the dykes, Trisoplast can have various functions, such as lining a dyke or as an anti-piping measure replacing a heave screen. This could prevent the use of large quantities of scarce clay, as well as the use of synthetic geotextiles.

A sustainable isolation solution

As a mineral sealing material, Trisoplast is made from a mixture of sand-bentonite combined with a polymer. The standard ratio of these raw materials is approximately 88.3% sand, 11.5% bentonite and 0.2% polymer. The highly effective isolation properties of Trisoplast are attributed to its fourth ingredient – water. A robust layer of this mixture is installed on-site and can be immediately covered with a layer of sand or soil. This layer of soil of sand provides the necessary overburden. Subsequently, any water from the surrounding soil that comes into contact with the Trisoplast layer is absorbed, creating a matrix of chemical bonds between the swelling clay minerals and the dissolved polymer. The resulting strong and dense hydrogel structure offers significantly superior isolation properties compared to traditional clay liners. This swelling hydrogel fills the pores in the granular filler (e.g., sand), producing the waterproof and flexible layer that distinguishes Trisoplast (Tritech Solutions, 2023).

Simultaneously, the gritty structure of the filler imparts mechanical strength to this mineral layer. The weight of the ballast layer helps the Trisoplast layer to maintain its optimal strength by preventing excessive swelling. Trisoplast has a substantial water retention capacity and it is resistant to shrinkage. Therefore, in situations where traditional clay liners tend to dry out and crack, Trisoplast will maintain its elasticity. Together, these properties result in a durable, safe and simple liner that is quick to install. Even when it has to be fitted around numerous connections (Tritech Solutions, 2020).
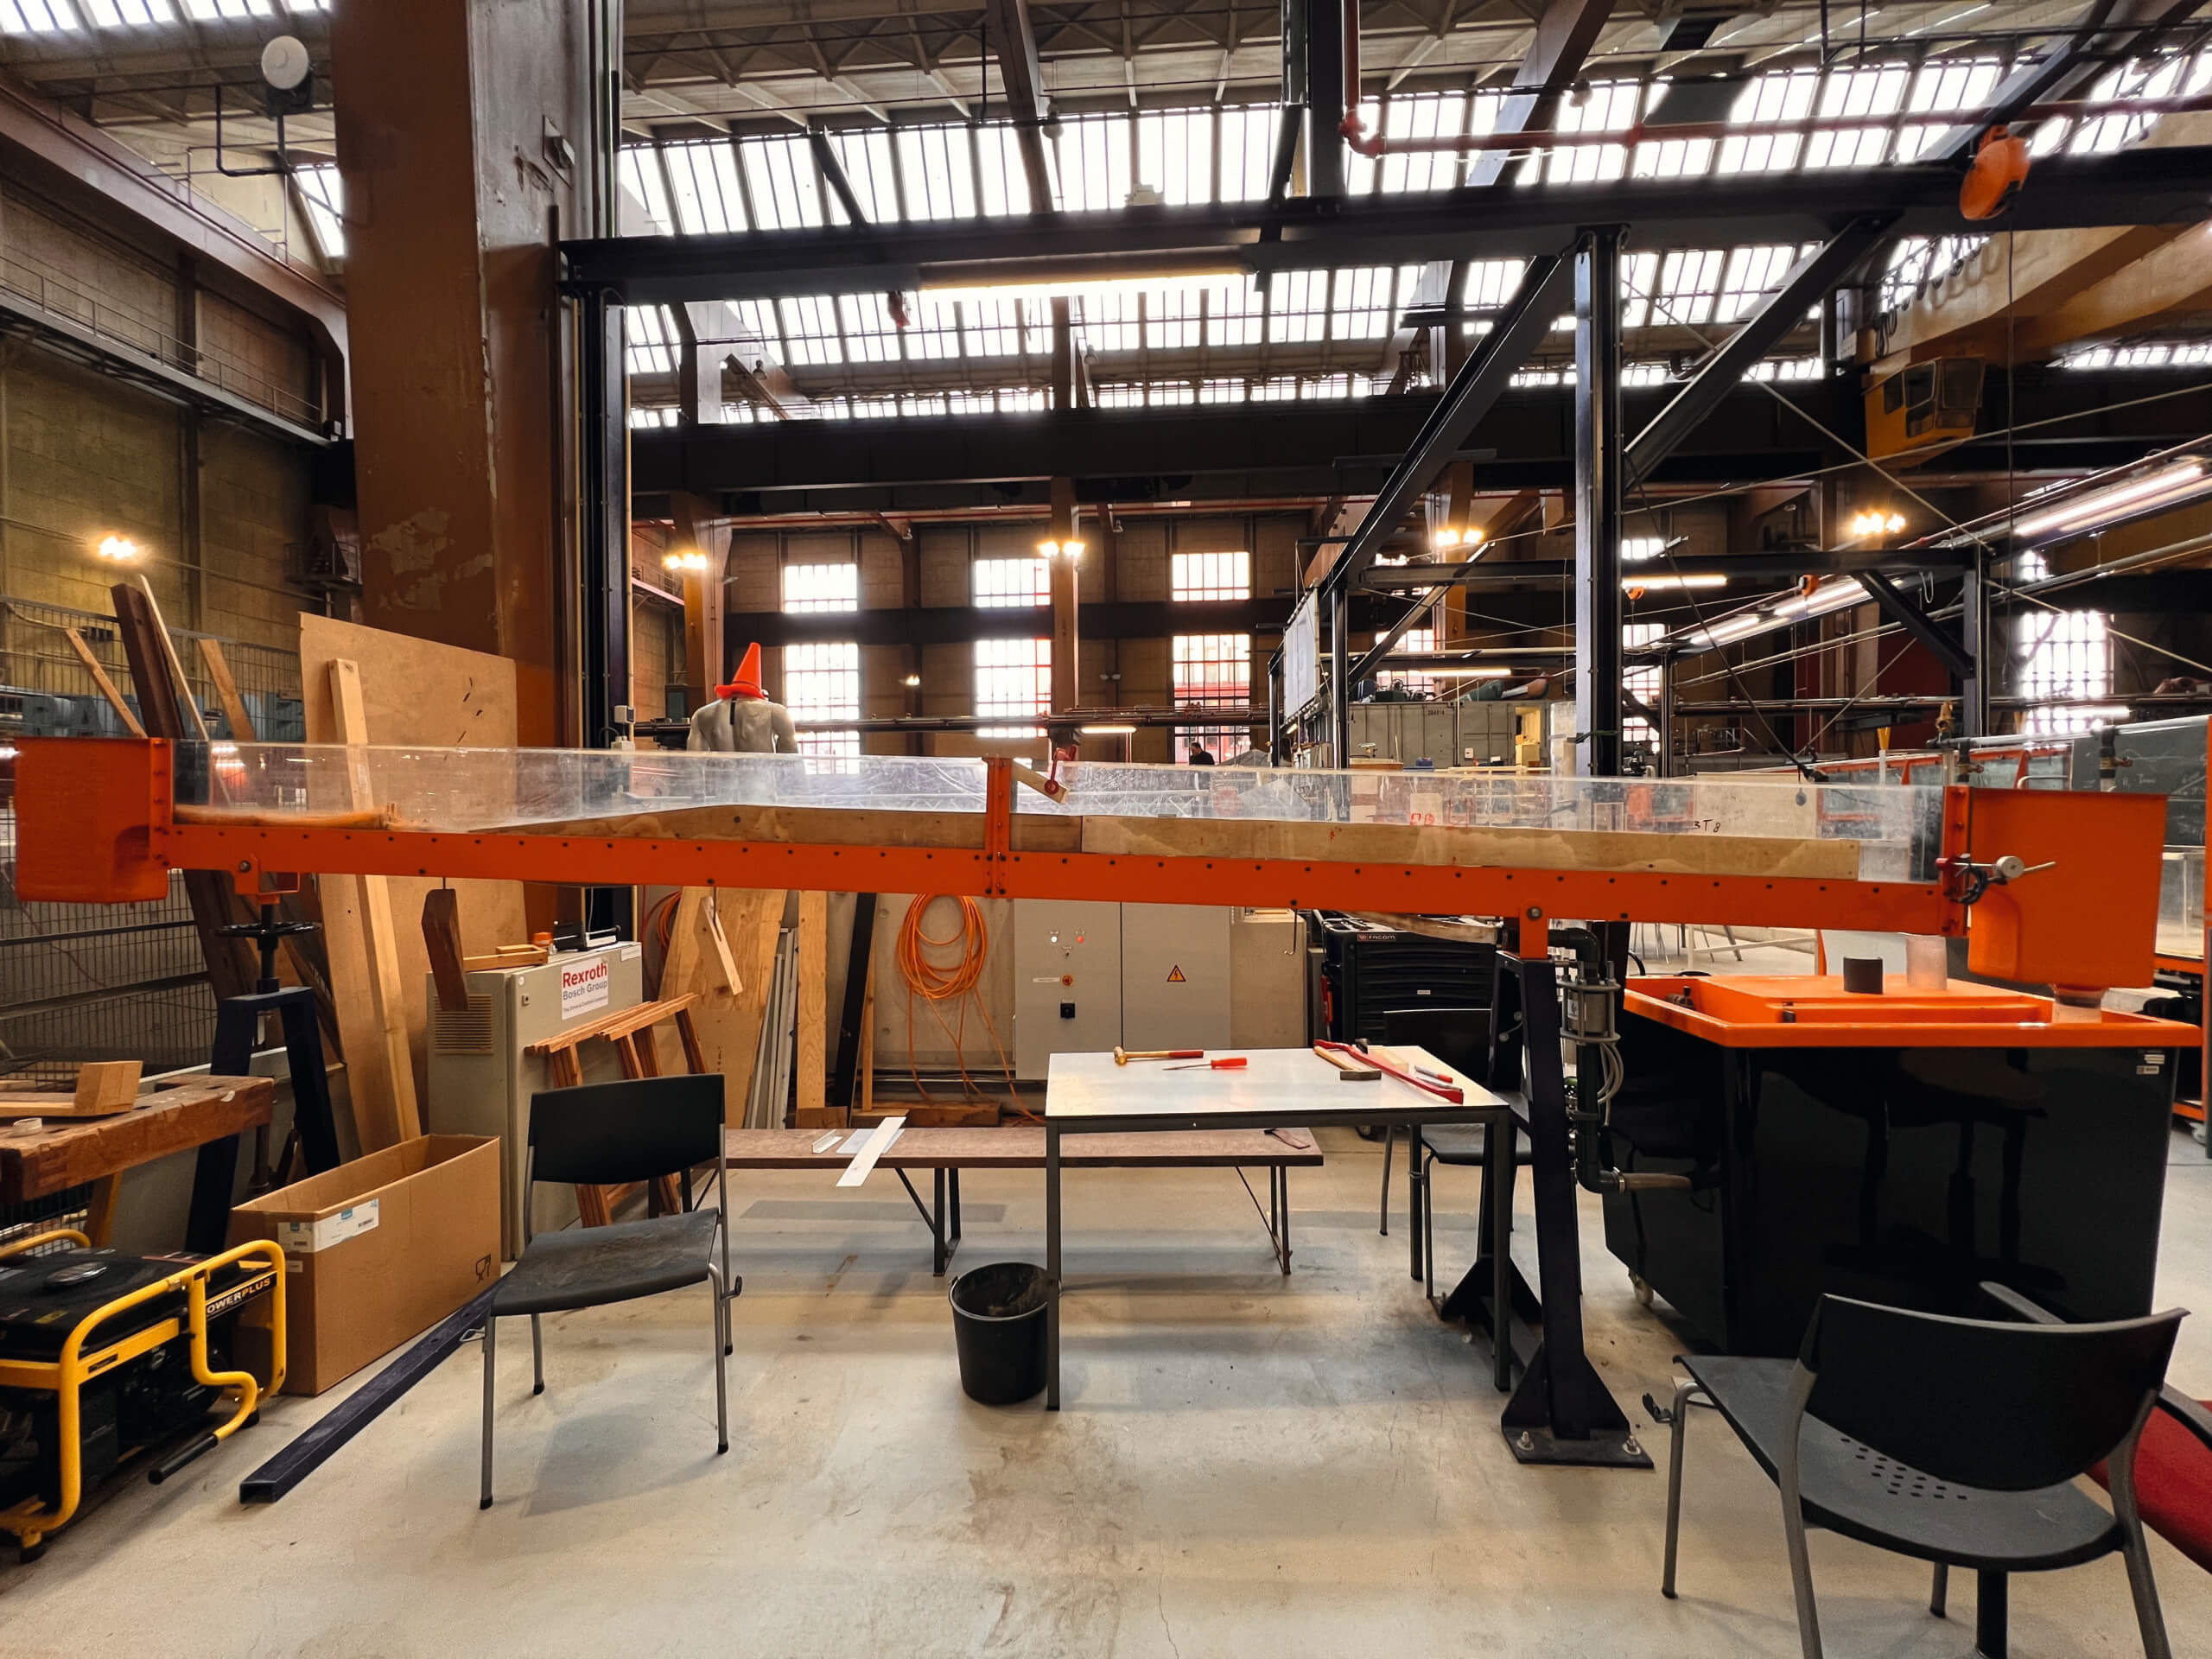
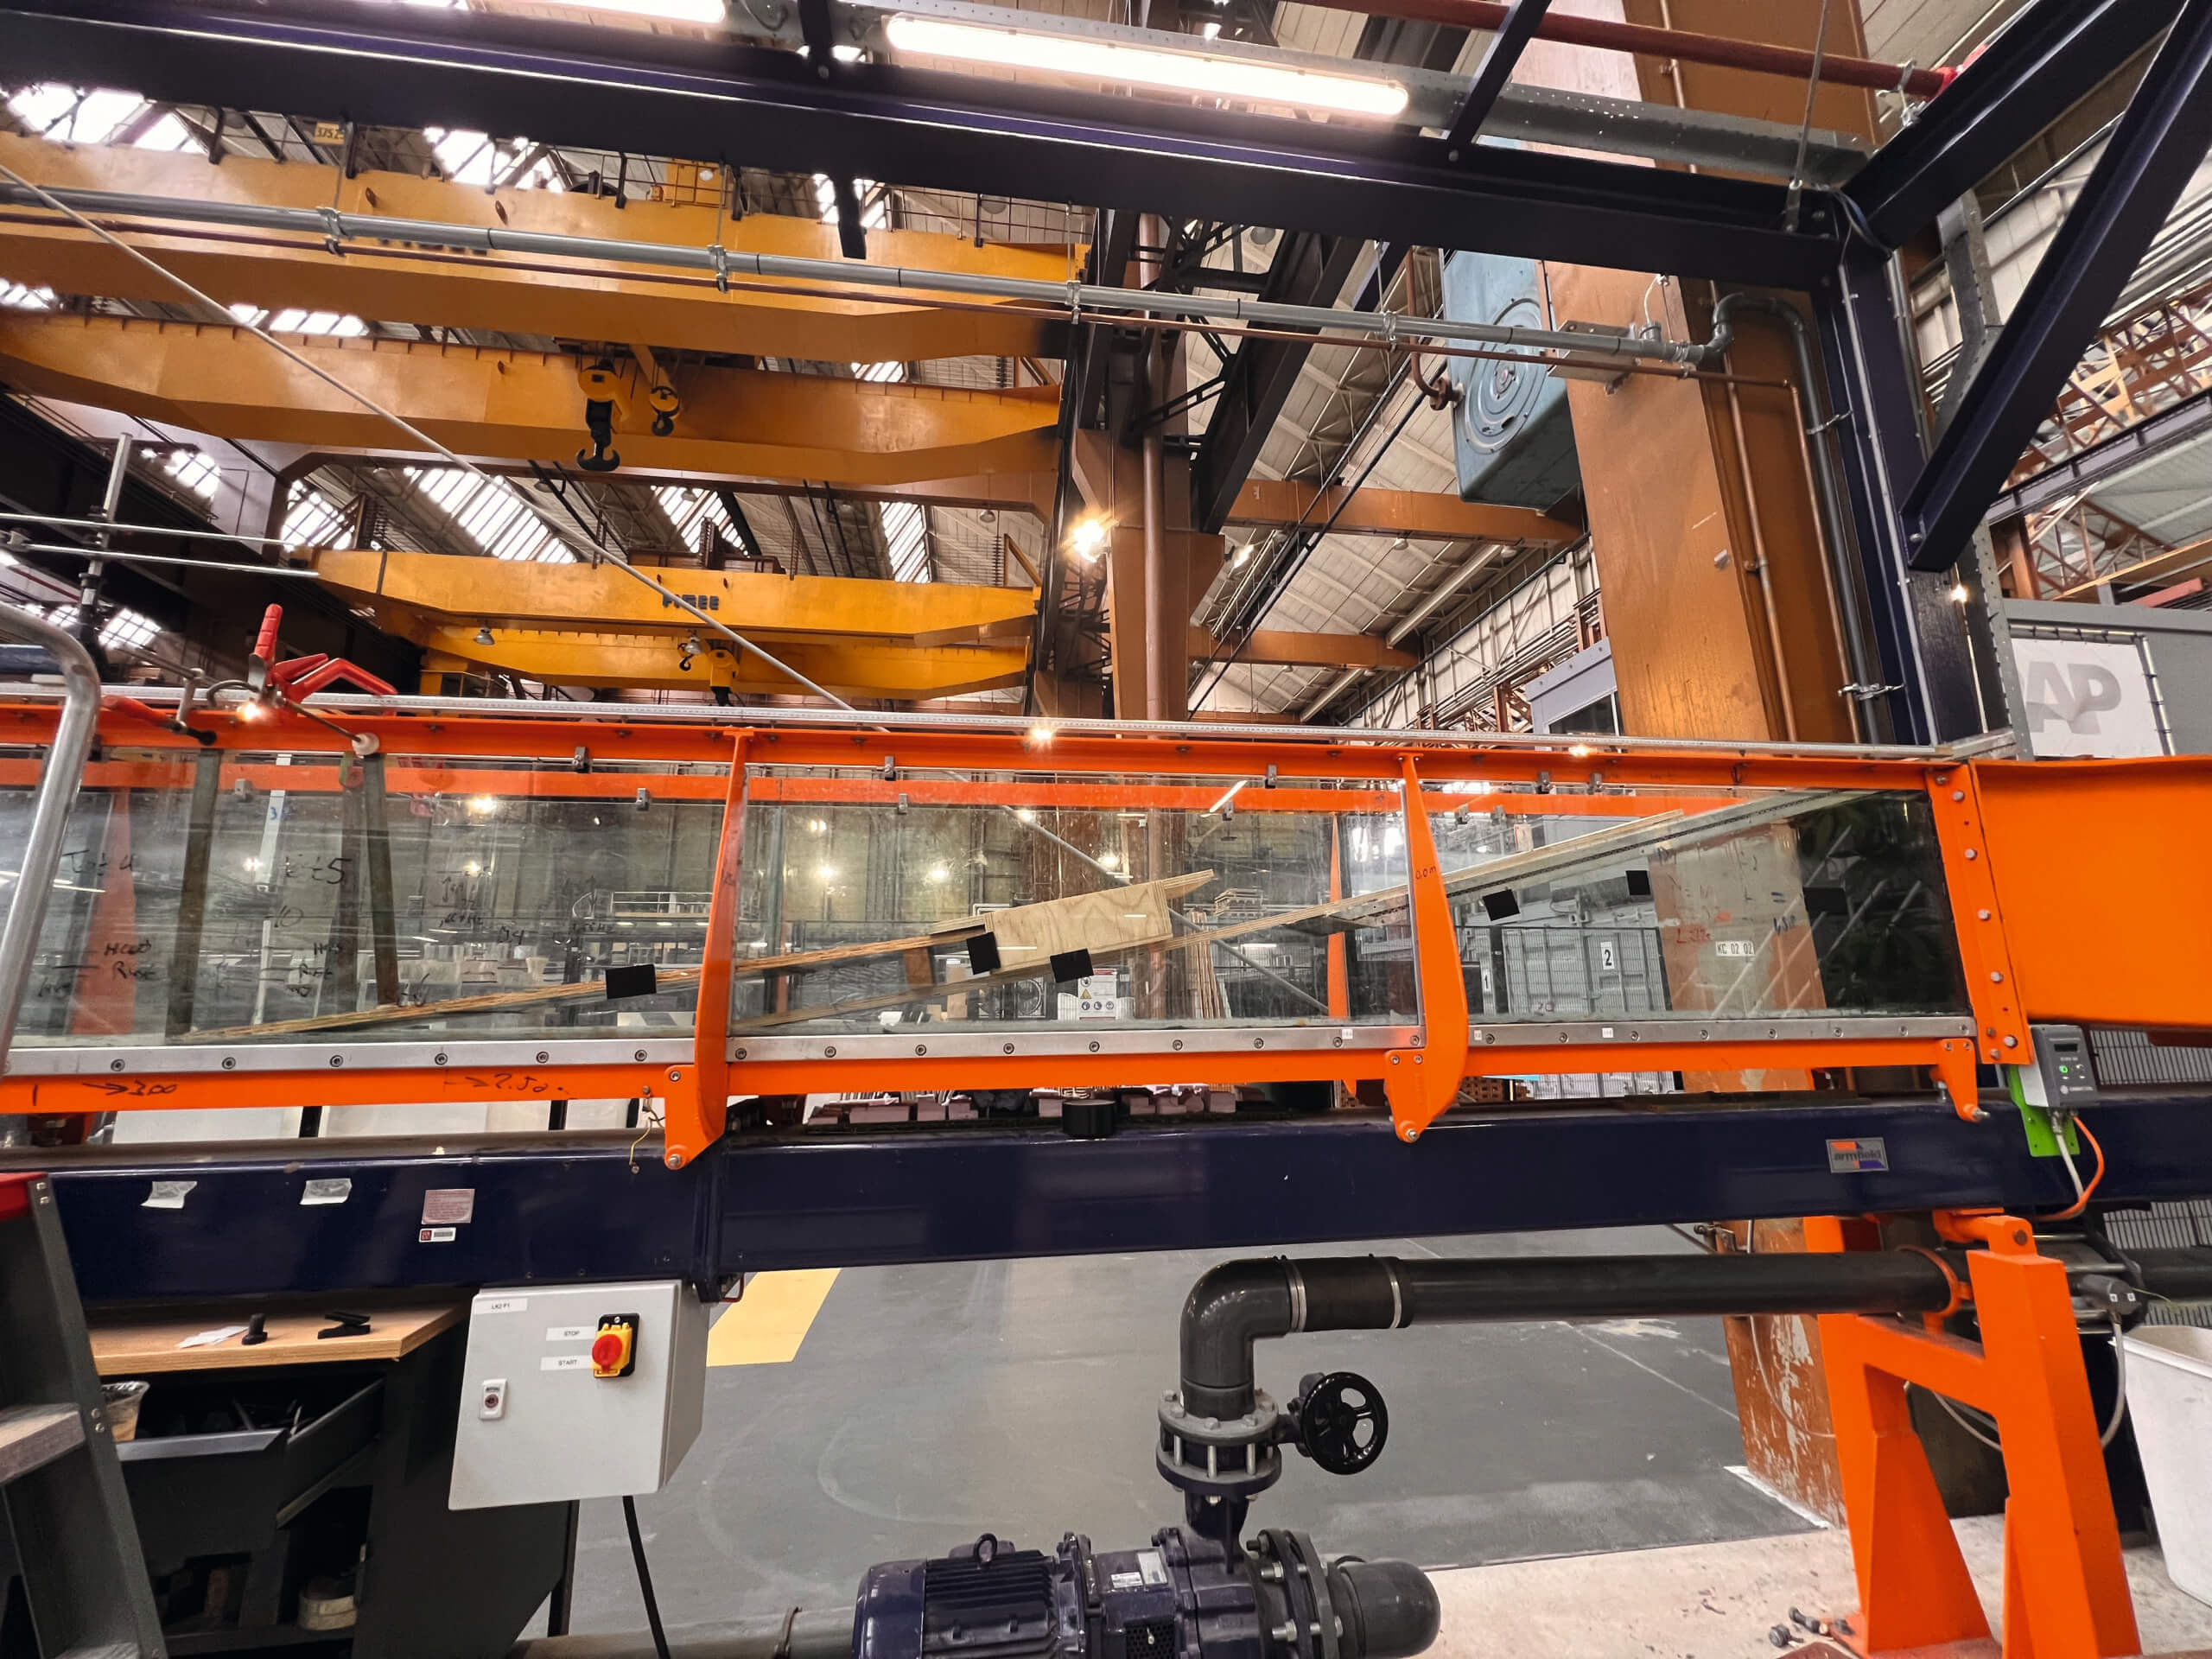
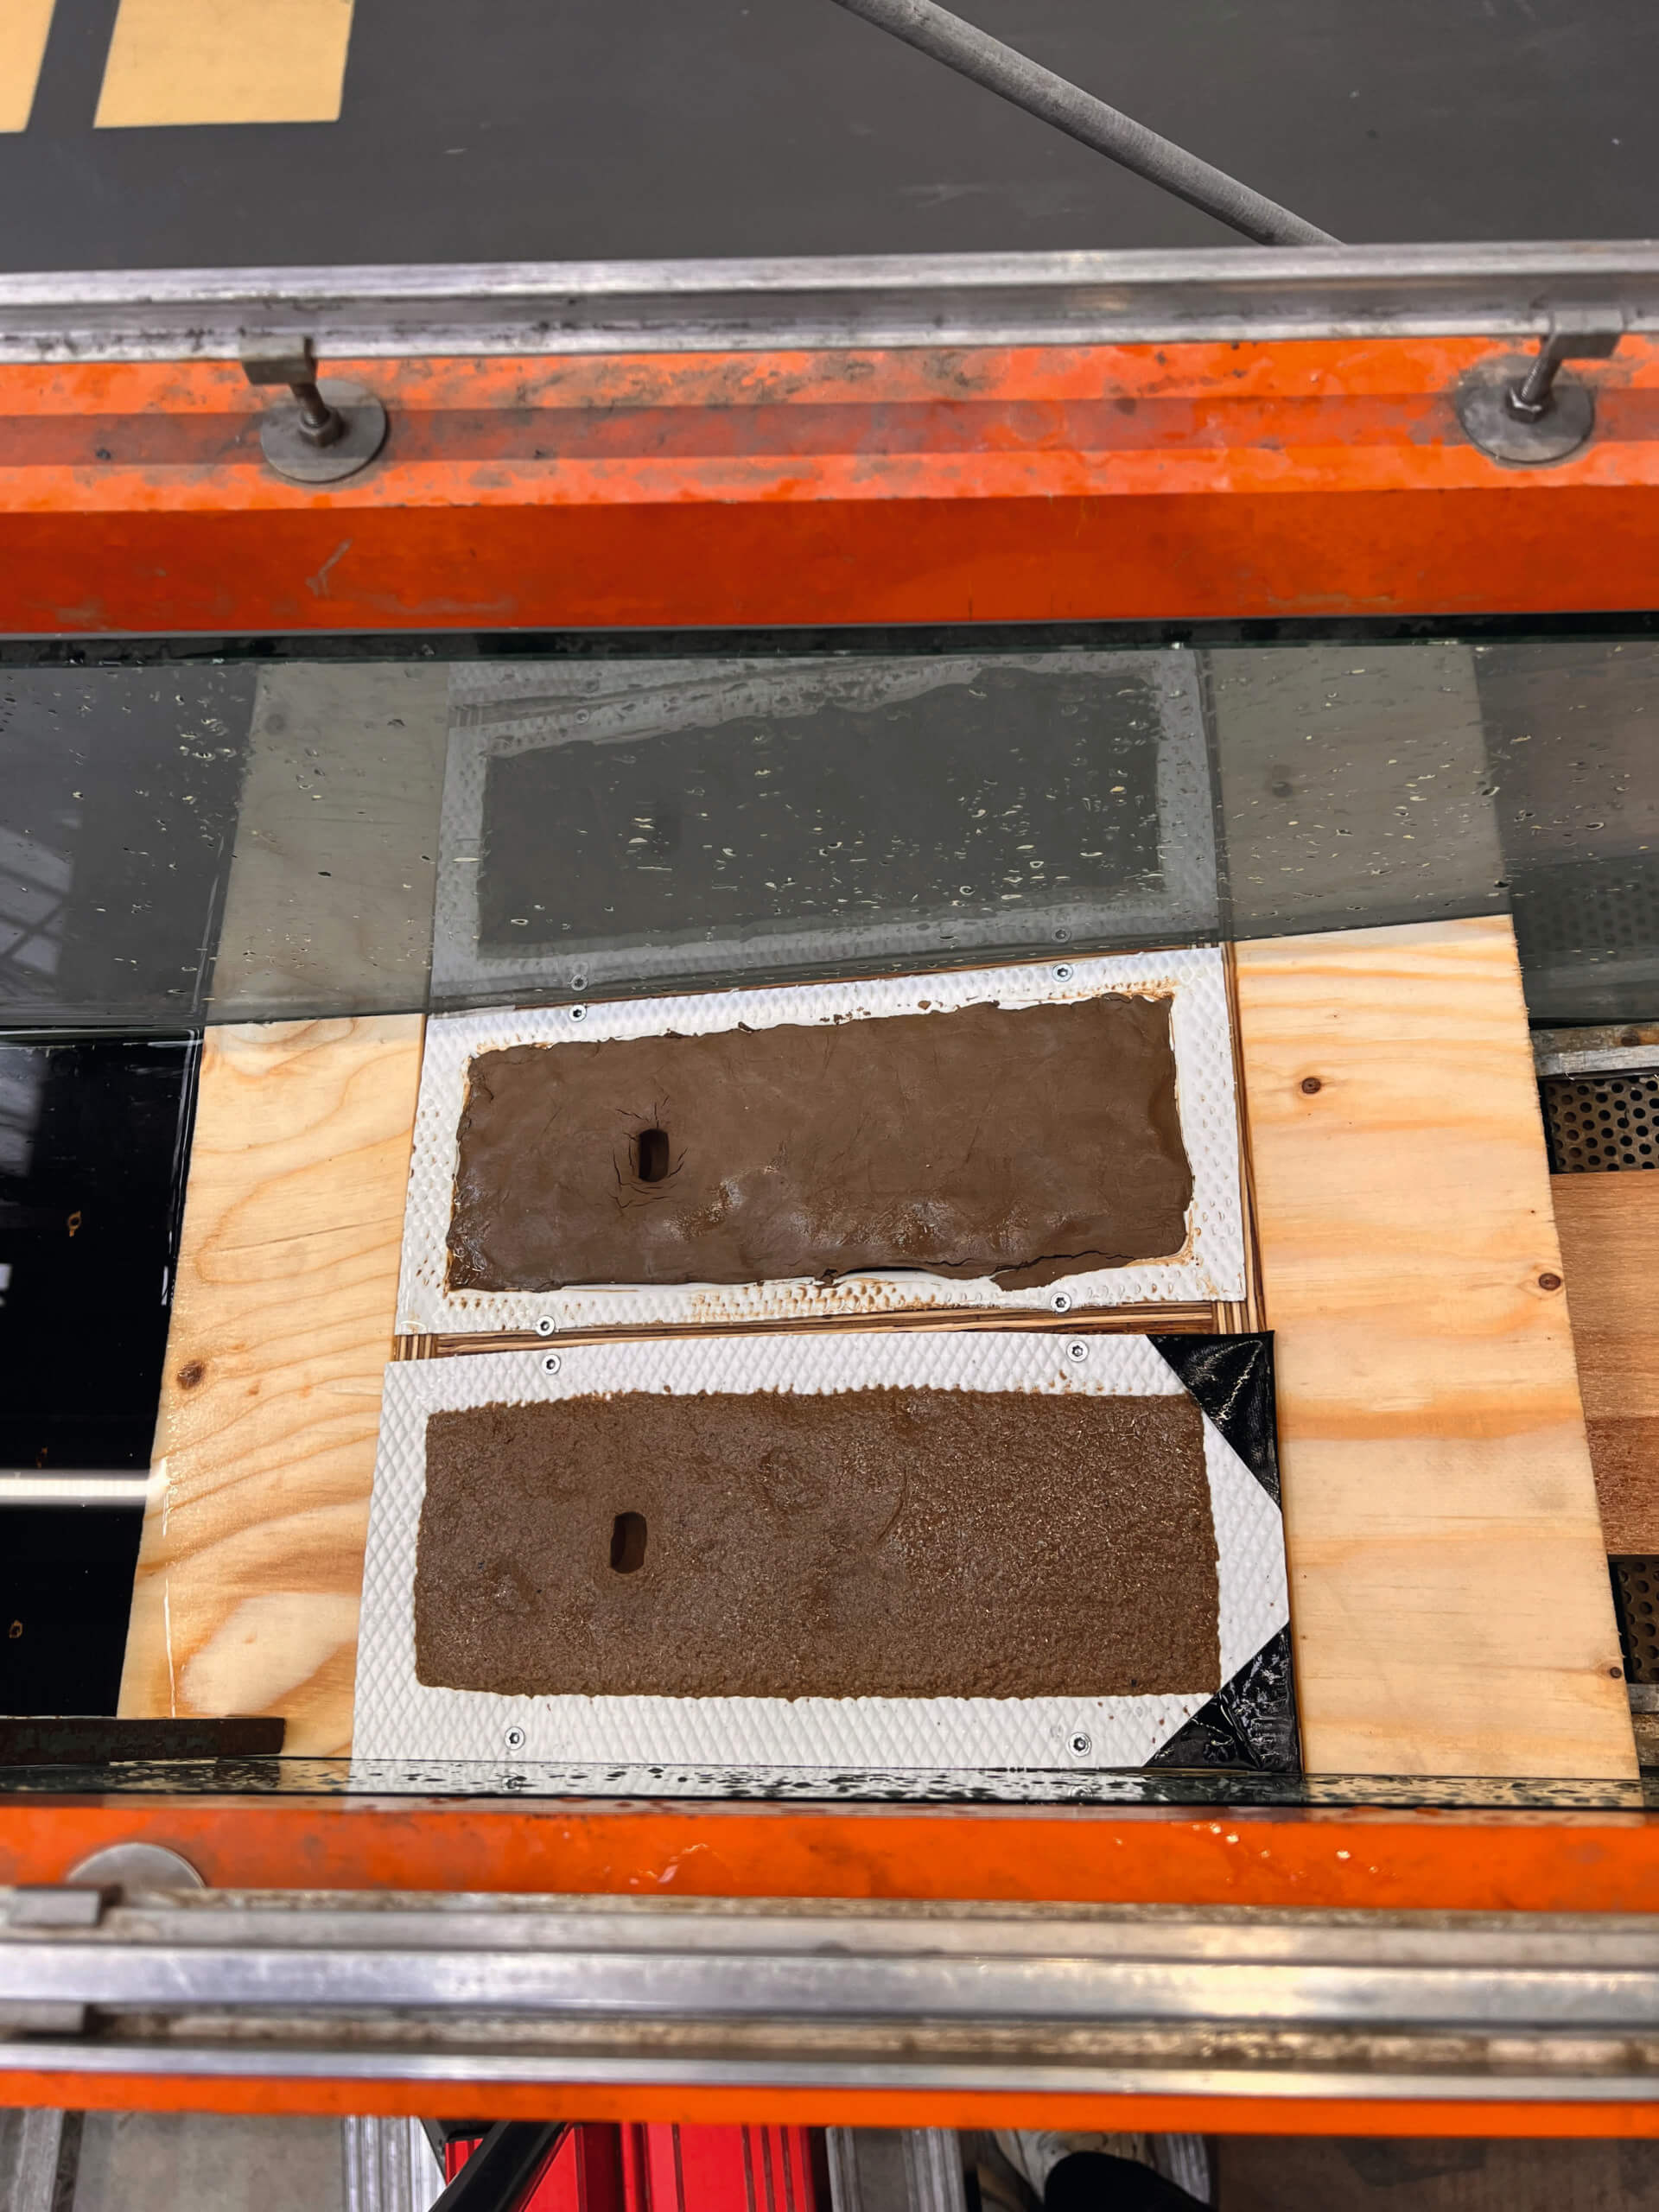
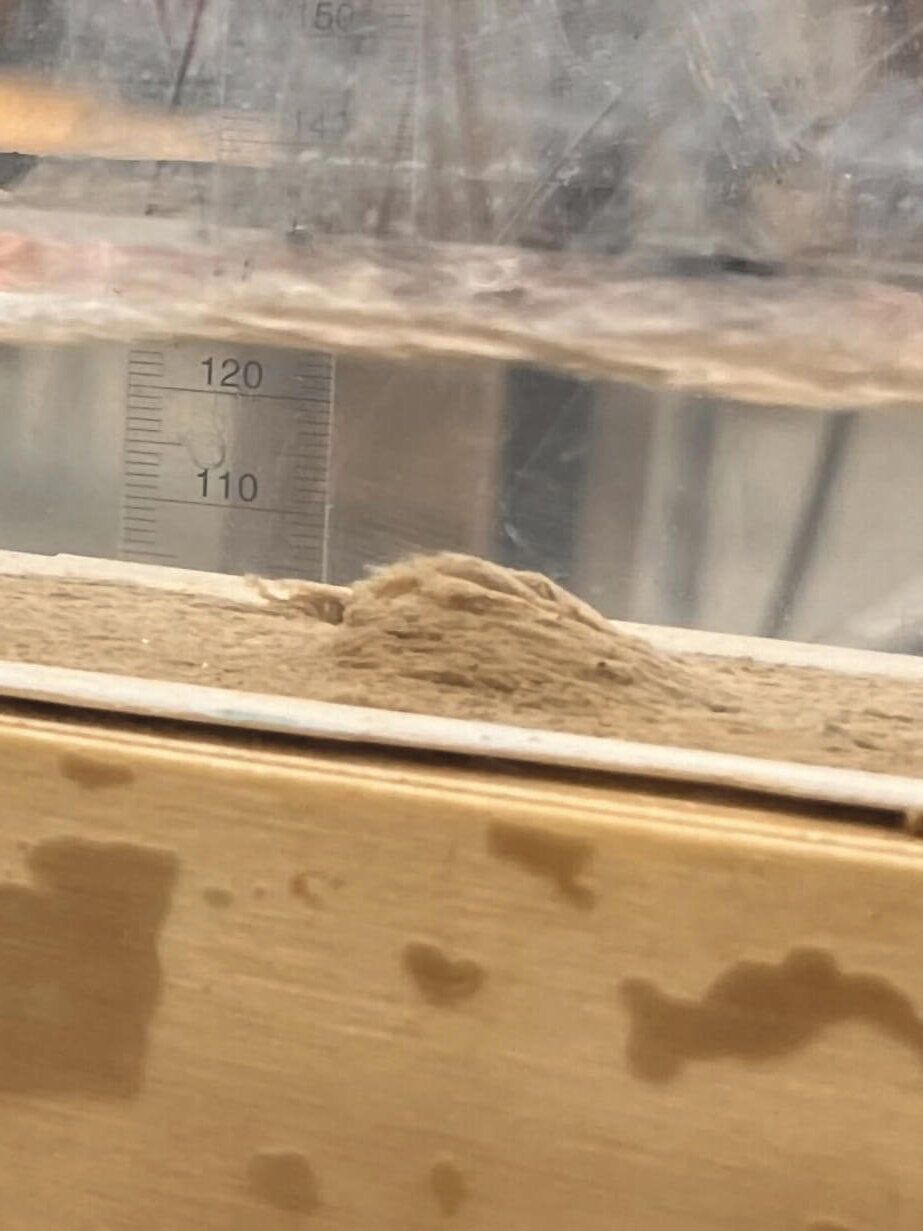
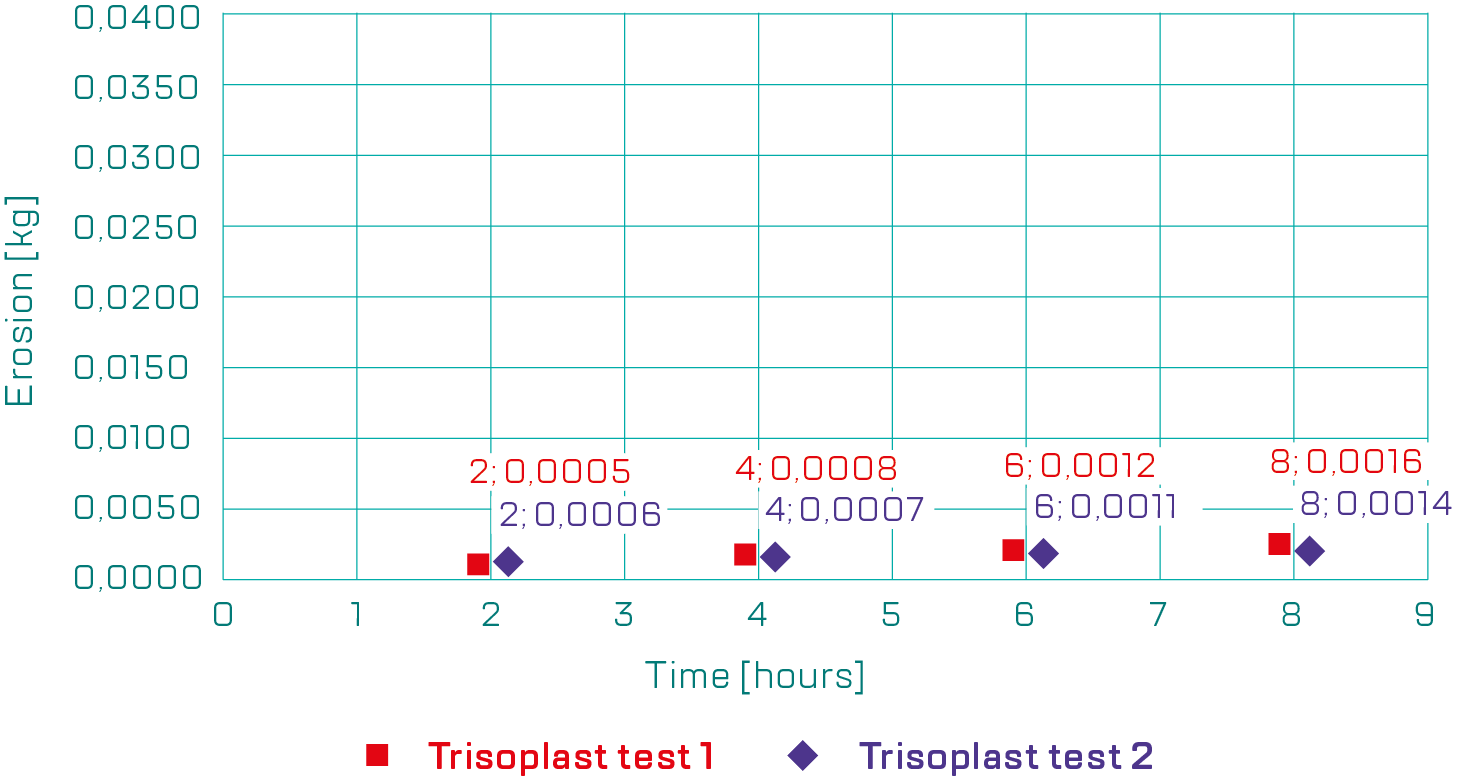
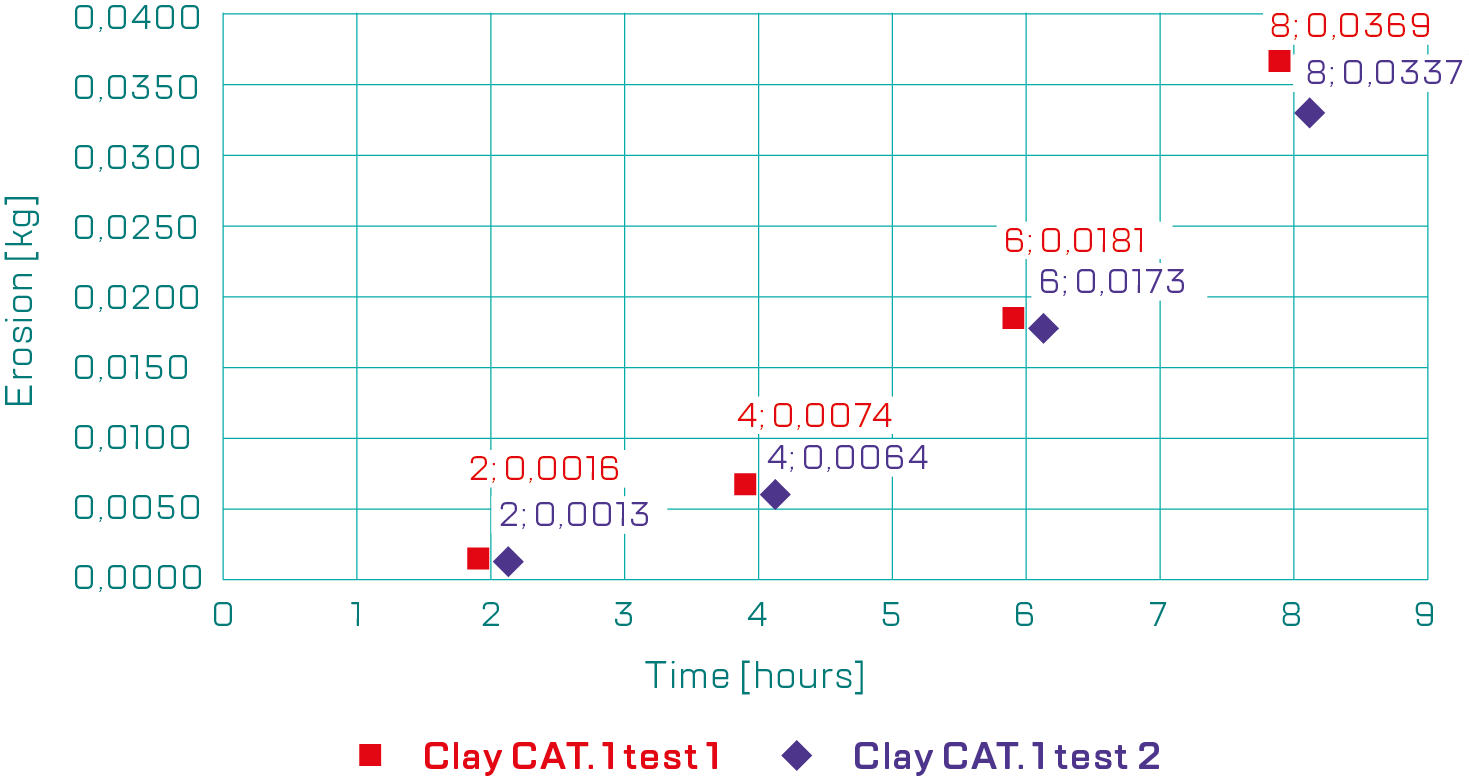
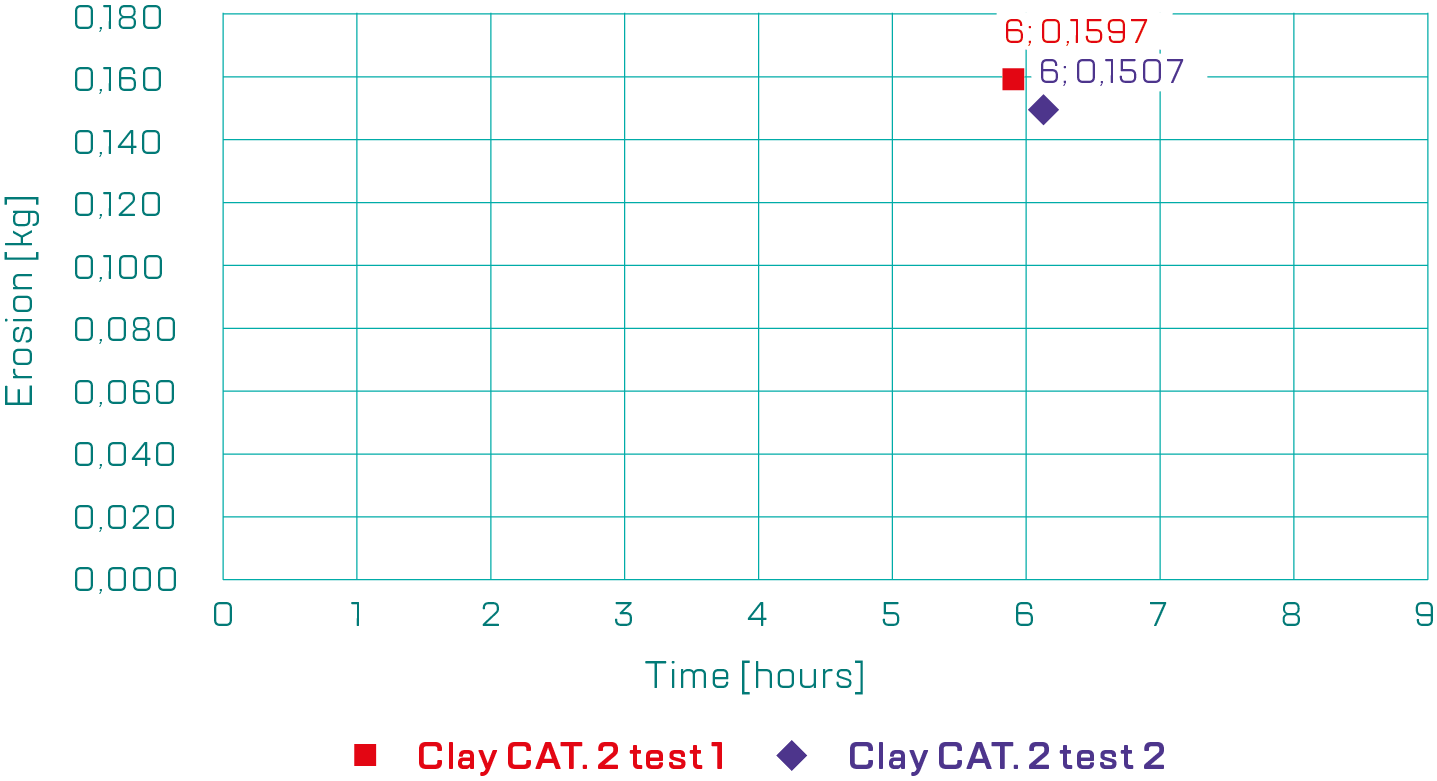
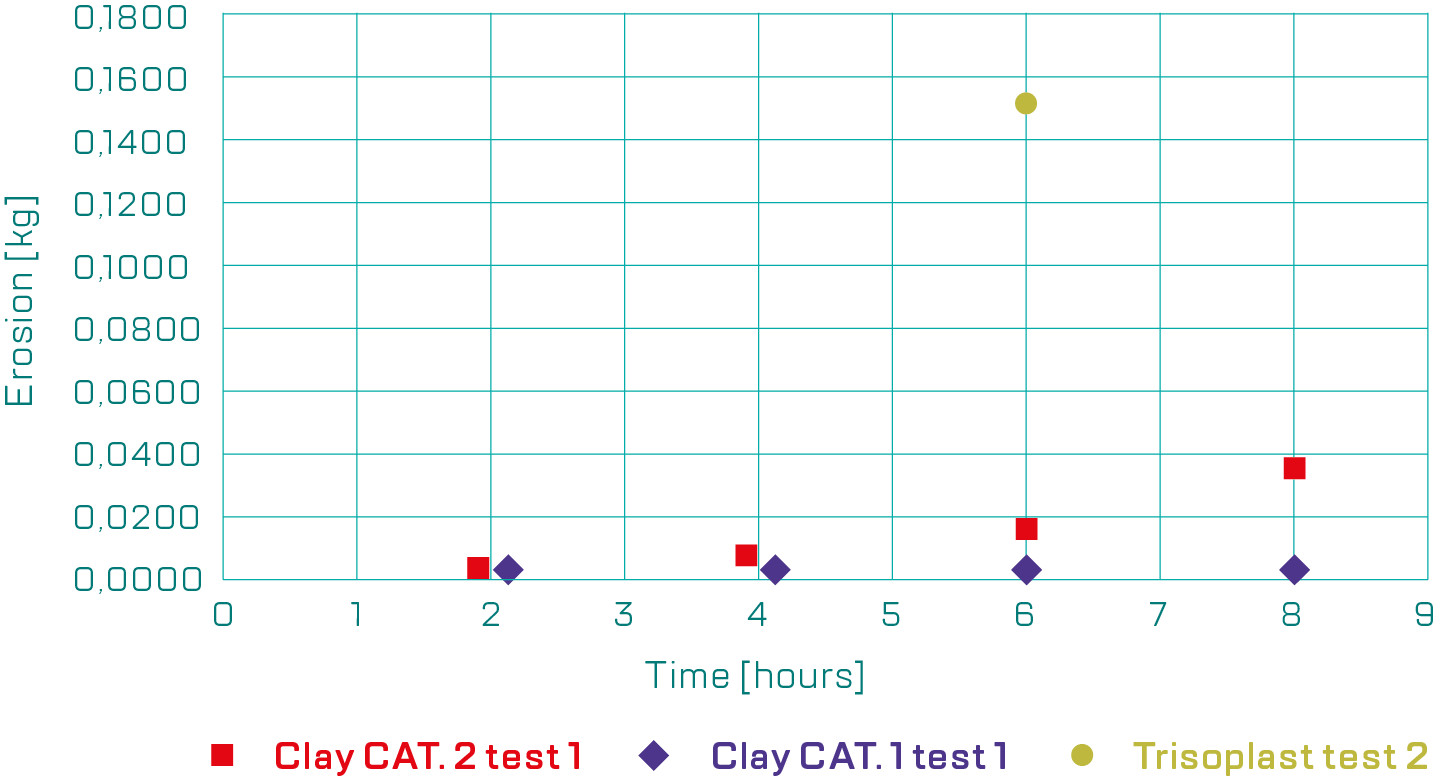
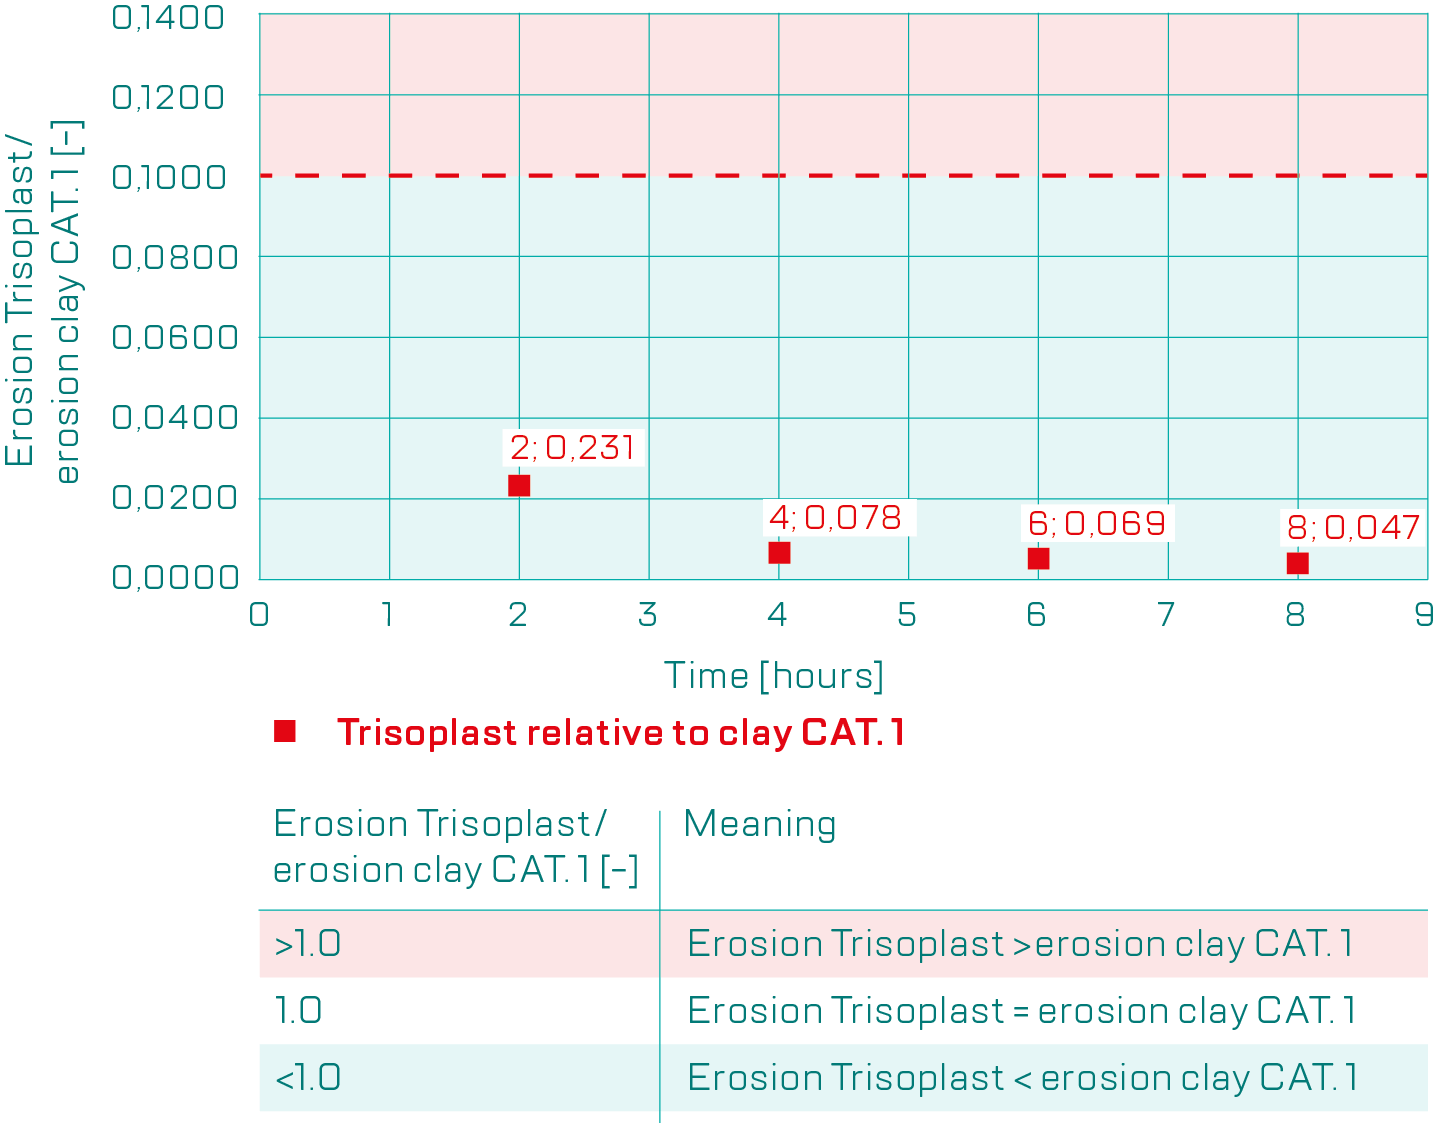
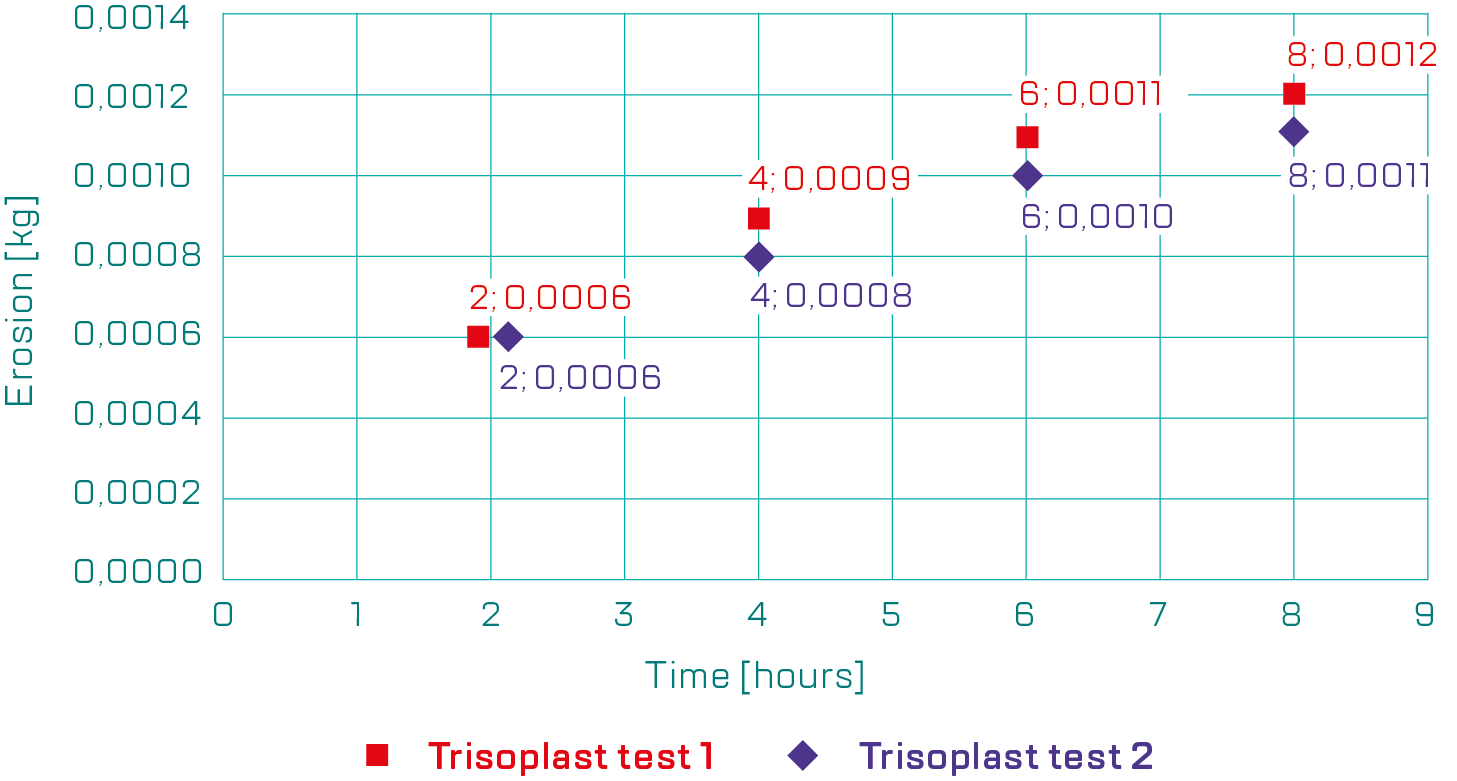
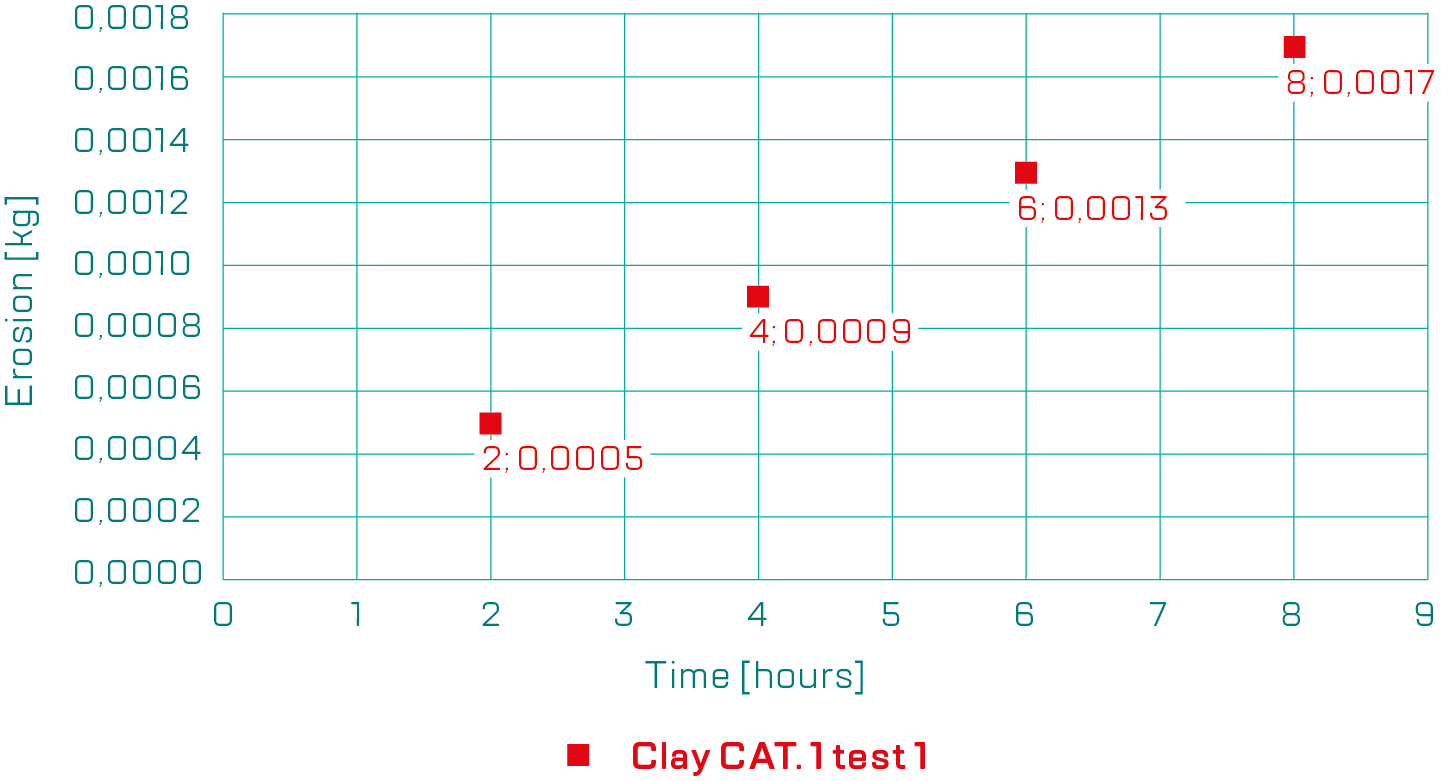
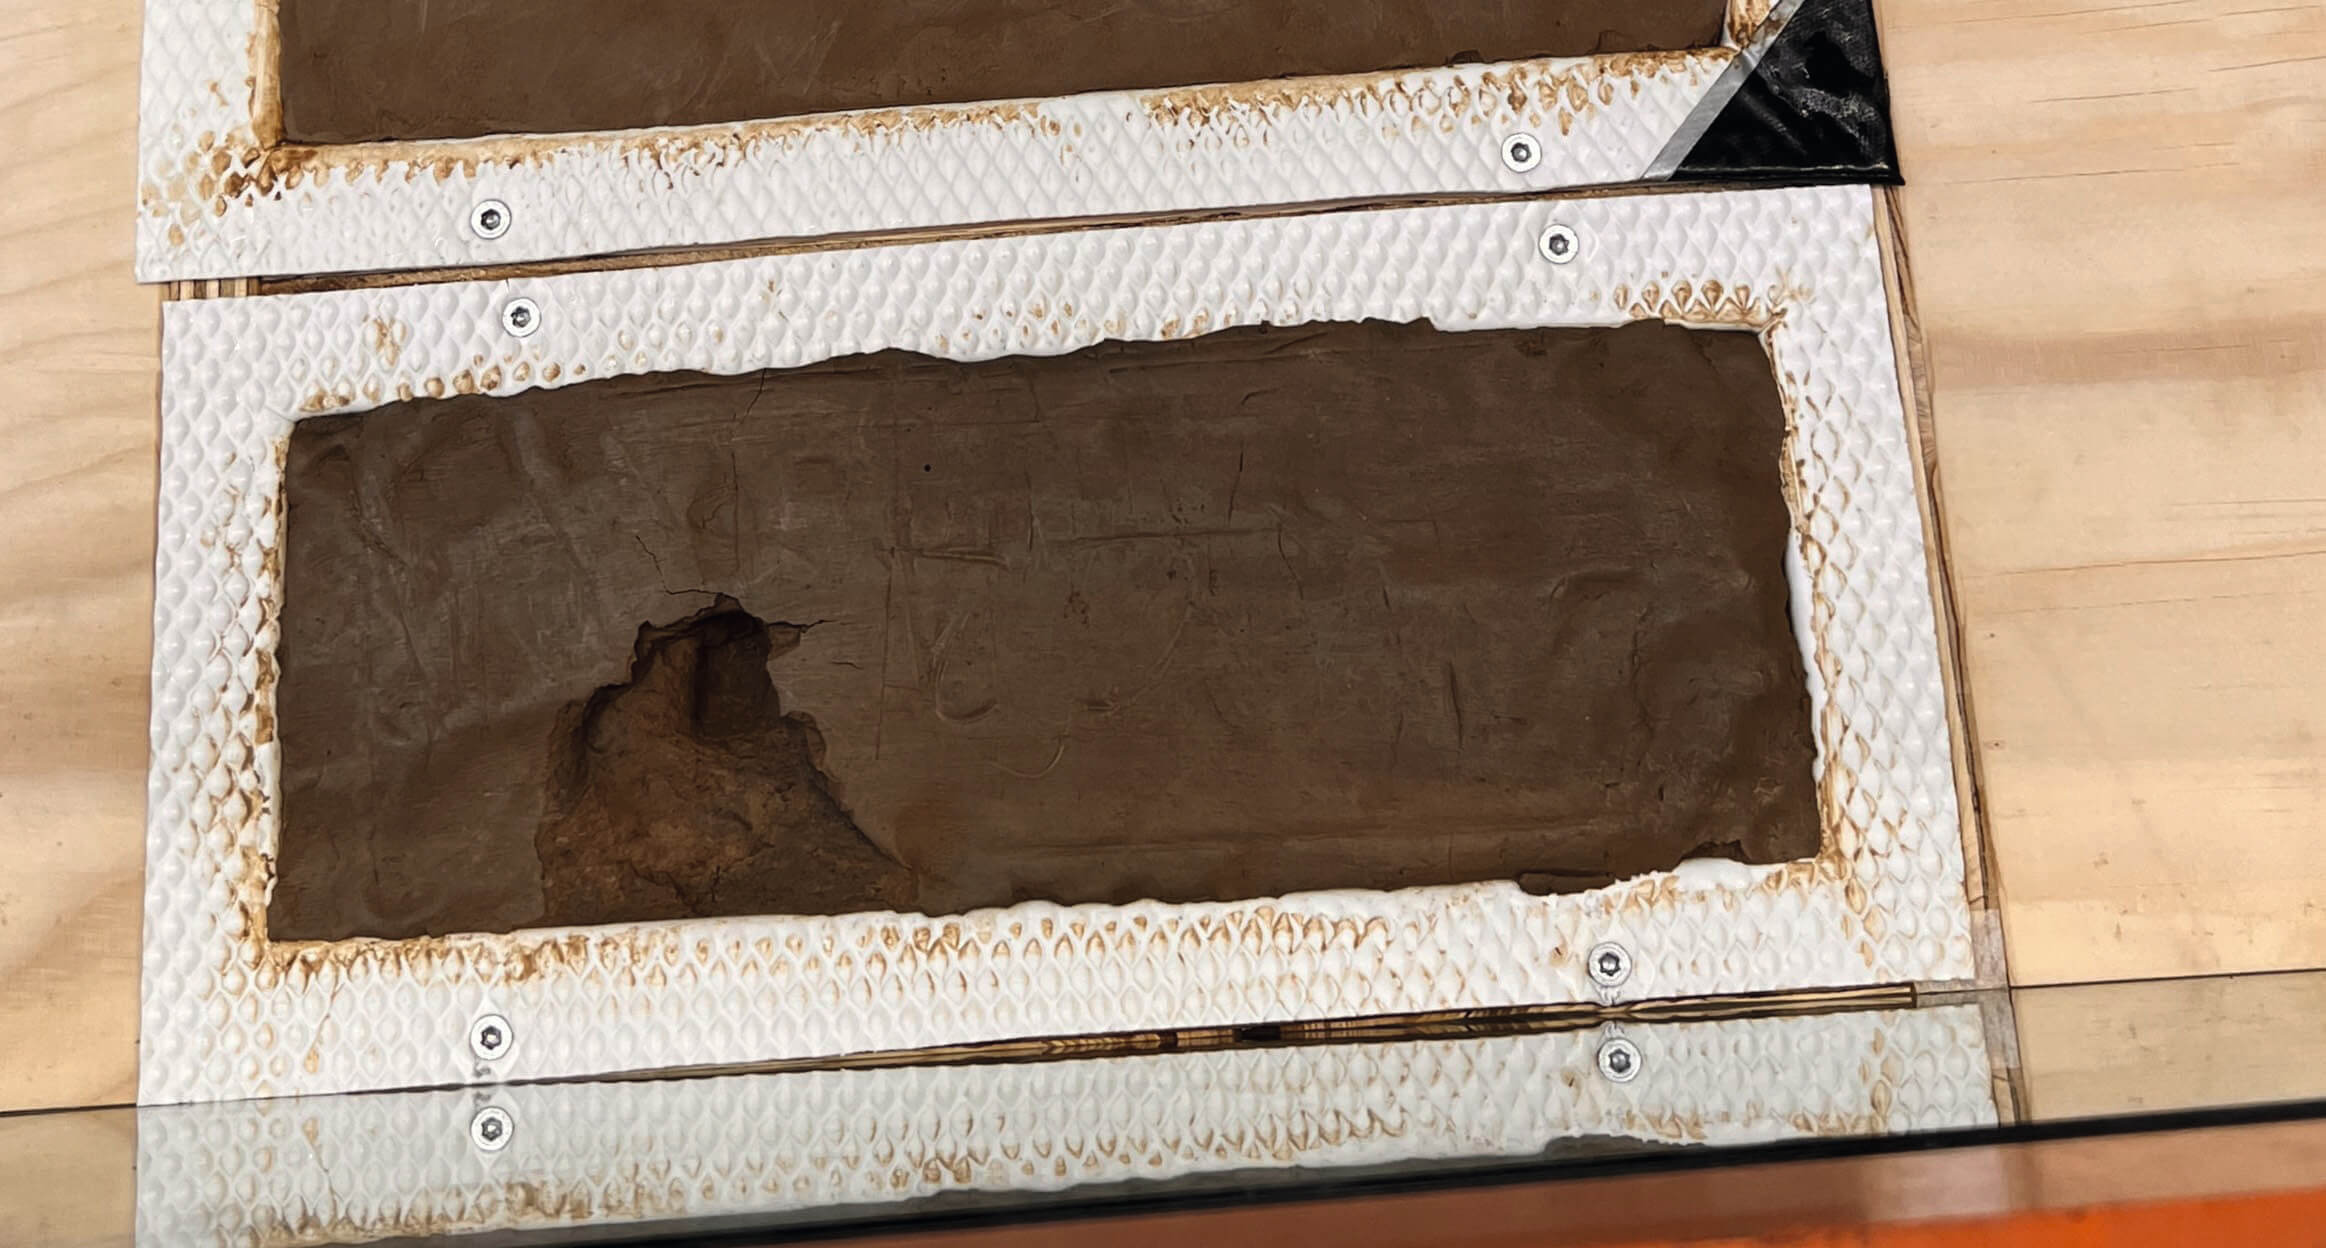
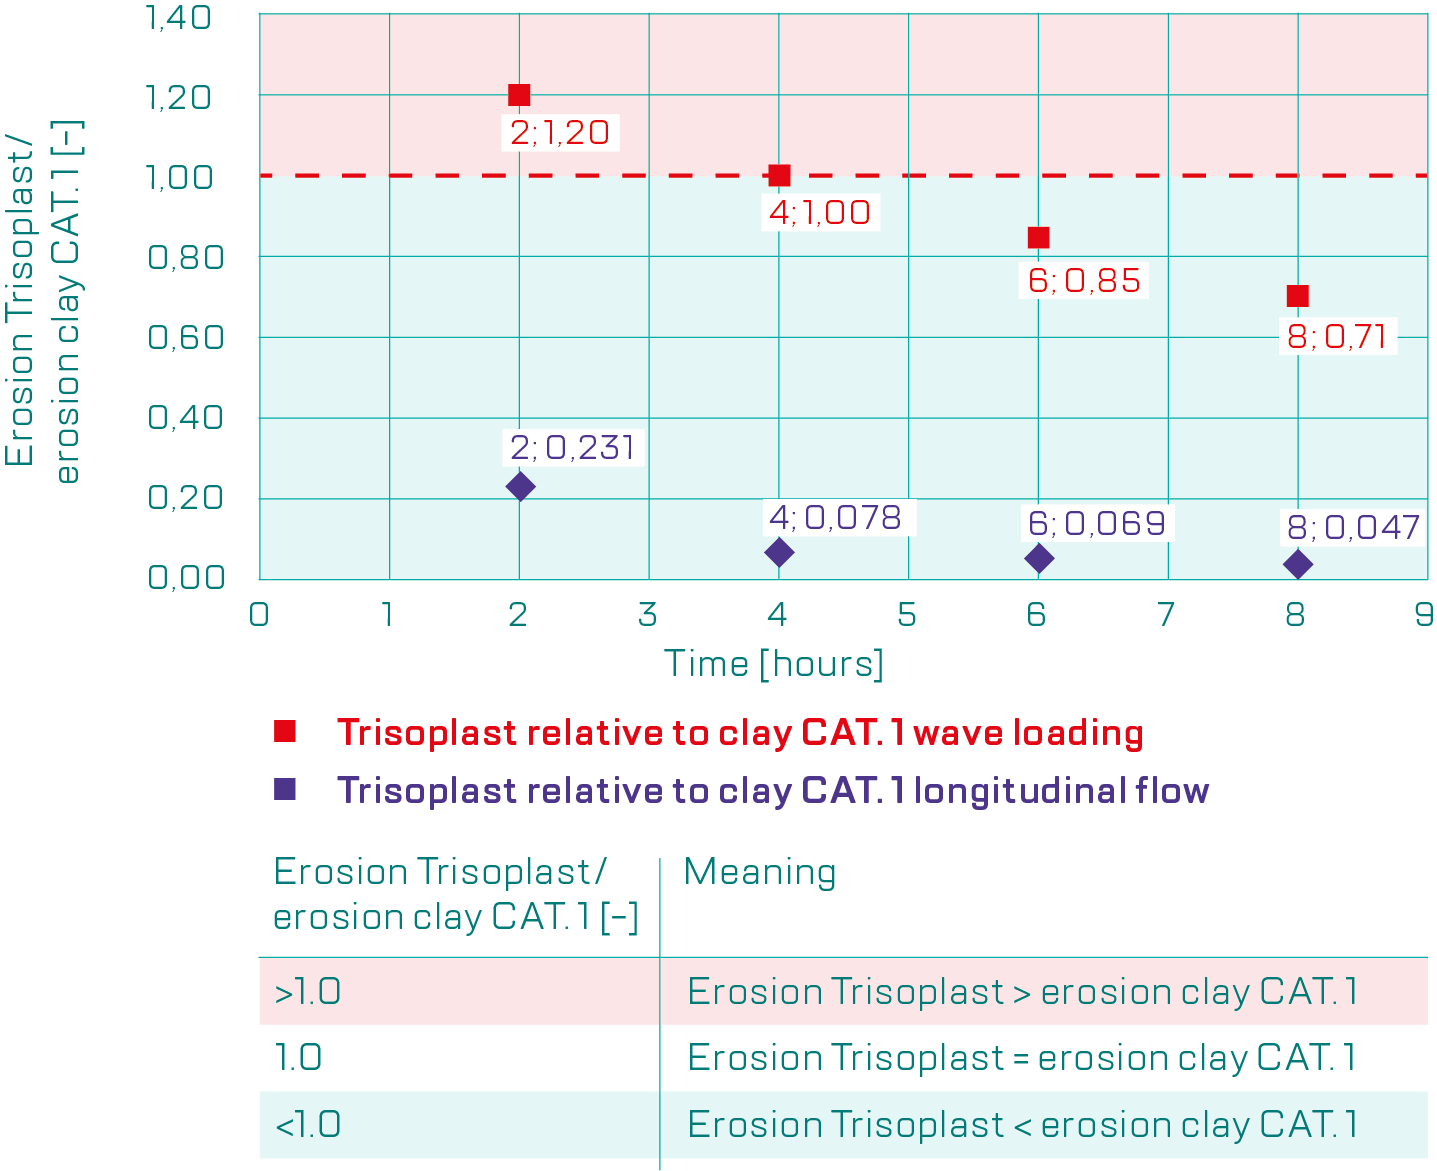
Flow flumes

The clay layer in dykes ensures that the structure will not collapse due to erosion or instability. To test whether Trisoplast is erosion-resistant, various tests were conducted. These tests were carried out in two different flow flumes available at the Aqualab of Rotterdam University of Applied Sciences in the Netherlands.

FIGURE 1

Armfield C4 tilting flume.

The first set of laboratory tests were longitudinal flow tests that were conducted in an Armfield C4 tilting flume (see Figure 1). The flume is set at an angle of 2.51°, achieving a maximum flow velocity of 1.61 metre per second (ms-1) with a water discharge of 3.16 to 3.19 litre per second (Ls-1) To perform these tests, the Trisoplast and clay samples were prepared in various custom-made molds. The molds filled with Trisoplast or clay are then placed in a wooden mold within the flume, which had a slope at the front to ensure a gradual transition between the flat surface of the flume and the Trisoplast or clay sample.

The second set of tests consisted of wave loading tests and were conducted in an Armfield S6 MKI flume (see Figure 2). This flume has a maximum water discharge of 21.5 Ls-1 and is equipped with a flap wave generator that can generate waves. For the tests, the samples were placed in a 1:5 slope, which is comparable to the outer slope of sea dykes (TAW, 1999). During these tests, a plunging wave is generated. Because of the breaking of the waves, a significant amount of energy is exerted on the slope, increasing the probability of erosion. To perform these tests, the Trisoplast and clay samples were once again prepared in various custom-made molds. The molds filled with Trisoplast or clay are placed in a wooden mold within the flume to ensure that the samples remained in the correct position during the tests.

FIGURE 2

Armfield S6 MKI flume.

Preparations

To prepare the tests, the moisture content of the materials is determined. This allows for the assessment of whether the materials needed to be moisturized or dried or if they are directly suitable for the compaction of the samples. The determination of the moisture content is done by weighing the samples and afterwards placing them in the oven. The next day, the same sample is weighed again and placed back in the oven. This process is repeated until it is observed that the weight no longer decreases, indicating that all the moisture had evaporated from the sample, which on average takes 4 to 7 days. Next, the density of the materials is determined by performing a proctor test for each material.

To ensure that the materials achieved the correct degree of compaction, the volume of the various molds is determined. Next, the different materials are weighed and compacted within the molds. For clay CAT. 1 and 2, a compaction degree of 98% is maintained (TAW, 1996), and for Trisoplast, a compaction degree of 90% (standard value) is used. After compacting the materials, the Trisoplast samples are submerged in water for a week to allow the material to swell and become saturated with water (Tritech Solutions, 2020).

The cover layer of a dyke consists of an underlayer and a top layer. The underlayer serves as the sealing layer of the dyke, which is usually a clay layer. The top layer often consists of grass or stone revetment. If this grass or stone revetment fails during a storm and the clay layer is exposed to the load, it is likely that this layer will be damaged. Wave loading can create holes in the grass or stone revetment. Since grass roots grow into the dyke, they can cause damage to the underlying clay layer. Therefore, a defect is also introduced in the samples to represent the form of these defects. This hole is made on the surface of the sample, 0.09 metre from the edge of the samples, as shown in Figure 3.

FIGURE 3

Defect in the samples representing the damage in the clay layer caused by wave loading.

Laboratory tests

Heavy loamy clay erodes at a water flow velocity of 1.5 ms-1 (Hoffmans and Verheij, 2021). For this reason, the maximum achievable water flow velocity in the Armfield C4 tilting flume is examined. As mentioned earlier, a maximum water flow velocity of 1.61 ms-1 is achieved. By conducting the tests at this water flow velocity, it is hypothesised that the clay samples will begin to erode.

For the tests, various loading durations were chosen to examine whether there is a correlation between the results per duration. Thus, the tests were conducted with durations of 2, 4, 6 and 8 hours. Longer than 8 hours are not possible in this setup.

To ensure the reliability of the results, all tests were carried out in duplicate. By choosing loading durations of 2, 4, 6 and 8 hours, it was possible to complete all longitudinal flow tests in 17 working days. For each separate test, a new sample was prepared and used, allowing for the results to be comparable with each other.

For the wave loading tests, the highest significant wave is selected based on the limits of the flume. To produce this wave, a water level of 0.32 metre is applied in the flume, which varied to 0.24 metre. This was due to the flume slowly emptying during the tests.

Due to the variation in water level, the wave breaks over the entire sample. The wave that was tested has the following properties:

  • Wave height [] : 0.14 metre
  • Wave length [] : 1.35 metre
  • Period [] : 1.0 sec

These values produced a plunging wave that breaks on the Trisoplast and clay samples, increasing the probability of erosion and therefore will benefit the research. The wave loading tests were also performed in duplicate. However, unlike the longitudinal flow tests, a new sample was not prepared and was not used for each test. For this reason, the results of these tests are cumulative.

Another difference with the longitudinal flow tests is in the wave loading tests two different samples were tested side by side (see Figure 3). In this way, it is possible to observe the difference in erosion between Trisoplast, clay CAT. 1 and clay CAT. 2 during the tests. Another reason for this choice is that it was difficult to set the same wave load per test. This was not the case with the longitudinal flow tests, which allowed the clay and Trisoplast samples to be tested separately during the longitudinal flow tests.

It is increasingly difficult to find enough clay that meets the required quality standards.

Measuring the erosion

To measure erosion in the longitudinal flow tests, two methods were used. The first method involved capturing the eroded material using a filter bag. This filter bag is attached to the outflow of the flume with a hose clamp. By using this method, all the water is filtered, preventing any recoverable material from being lost. The filter bags are only capable of capturing sand and clay; the bentonite and polymer could not be captured with these filters. For this reason, the weight of the eroded material (from Trisoplast) is multiplied by 13.3%. This percentage is based on the standard ratio of Trisoplast.

The second method for measuring the eroded material involved weighing the samples before and after the tests. This approach allowed for verification that the filter had captured all the eroded material. Additionally, the moisture content of the samples was determined before and after the tests. This ensured that any increase in moisture content during the tests, which could affect the measured erosion, is accounted for. This procedure was applied to both the clay and the Trisoplast samples.

Results longitudinal flow test: Trisoplast

During the tests with Trisoplast, it was observed that two samples showed a local accumulation (Figure 4) of the material of approximately 1.5 to 2.0 cm. This local accumulation is a cluster of sand-bentonite- polymer gel where the bentonite has freely swelled, while the polymer matrix holds it together (Tritech Solutions, 2020). This explanation is confirmed by examining the local accumulation after the tests, during which it is opened. Upon opening the accumulation, no anomalies were observed in the material, making it likely that the material has freely swelled. This observation was made during the 6-hour and 8-hour tests. An explanation for this phenomenon is not known, nor why it did not occur in all tests.

FIGURE 4

Local accumulation during the longitudinal flow tests.

Furthermore, it was observed that a large amount of the total eroded material had been washed away during the first hour of the tests. These observations were discussed with Tritech Solutions, who explained that this occurred because the loose particles were not well adhered to the sample. For this reason, the loose particles were washed away immediately after the start of the tests.

The data points of the longitudinal flow tests with Trisoplast are shown in Figure 5. This graph shows the results per test, with the horizontal axis representing the duration of the tests and the vertical axis representing the erosion of the Trisoplast sample. This choice is made because the erosion did not occur evenly across the entire sample, making it impossible to plot the erosion in millimetres or kg/m2.

FIGURE 5

Data points erosion Trisoplast during longitudinal flow tests.

As mentioned, the loose particles of the Trisoplast sample that were not well adhered eroded during the first hour of the tests. The amount of these loose particles that washed away varies per Trisoplast sample but does affect the results of the tests. Because these loose particles eroded immediately, the results of the erosion of the 2-hour tests are relatively high compared to the tests with a longer loading duration, as shown in Figure 5.

Results longitudinal flow tests: clay CAT. 1

All tests with clay CAT. 1 showed a consistent behavioural pattern, where small grooves are observed to form on the surface of the clay samples within the first hour of the tests. At the locations where these grooves are deepest, “flakes” began to erode from the sample (Figure 7).

FIGURE 6

Data point erosion clay CAT. 1 during longitudinal flow tests.

FIGURE 7

Erosion clay CAT. 1 during longitudinal flow tests

Figure 6 presents the data points of the longitudinal flow tests with clay CAT. 1. This graph shows that the erosion of the clay samples doubles as the duration of the tests increases. This can be explained by the fact that the flow no longer moves over a smooth surface, causing more turbulence and, consequently, inducing more erosion. However, during the tests, it was noted that the erosion did not start at the edges of the clay sample but in the middle. It is possible that this is a result of the wall effects of the flume. Due to these wall effects, the velocity in the middle, between the walls, is higher than at the sides of the flume.

Results longitudinal flow tests: clay CAT. 2

During the tests with clay CAT. 2, it was observed that the samples in both 8-hour tests eroded significantly more than the samples did in the 6-hour tests. For this reason, the clay samples were reclassified by an independent laboratory after the tests. The results of this reclassification showed that the clay samples with an 8-hour loading duration are not equivalent to clay CAT. 2 but to CAT. 3. Since the research focuses on the differences between the erodibility of Trisoplast and clay (specifically clay CAT. 1 and clay CAT. 2), the data points from the 8-hour tests were excluded from the results.

Additionally, after five hours of testing, the clay samples showed such a significant amount of erosion that the water became turbid. This made it impossible to record observations.

FIGURE 8

Data points erosion clay CAT. 2 during longitudinal flow tests.

As previously mentioned, the data points from the 8-hour tests were excluded, leaving only the results from the 6-hour tests shown in Figure 8. This graph shows that the results of both tests differ by 0.009 kg. These observations are remotely the same as recorded with clay CAT. 1. The only difference is that the erosion in clay CAT. 2 started in the first hour, while the first “flakes” of the CAT. 1 clay sample did not erode until the second hour.

Comparison of different materials: longitudinal flow tests

To determine which material is more erosion- resistant, the results of Trisoplast, clay CAT. 1 and clay CAT. 2 were compared (Figure 9). This comparison is made by using, for Trisoplast, the test with the most erosion, and for clay CAT. 1 and clay CAT. 2, the test with the least eroded material. By comparing these tests results the ratio between the erosion of Trisoplast and clay CAT.1 and CAT.2 is shown in the most unfavourable way. Since only one data point is recorded for the tests with clay CAT. 2, the following comparison was made with only Trisoplast and clay CAT. 1.

FIGURE 9

Data points erosion Trisoplast, clay CAT. 1 and clay CAT. 2 during longitudinal flow tests.

Figure 10 presents a comparison made between the erosion of Trisoplast and clay CAT. 1. This was done by comparing the results of test 2 of Trisoplast with test 1 of clay CAT. 1, within a time interval of 2 hours. In this graph, the horizontal axis represents the duration of the tests and the vertical axis represents the ratio of Trisoplast eroded to clay CAT. 1. The following applies to this graph:

FIGURE 10

The ratio of erosion of Trisoplast relative to clay CAT. 1 during longitudinal flow tests.

By plotting the results of the tests, it shows that with a loading duration of 2 hours, Trisoplast erodes relatively more. This occurs because, at the beginning of the test, the Trisoplast sample exhibits a lot of erosion due to the washing away of loose particles. It also shows that as the test duration increases, the erosion of Trisoplast relative to the erosion of clay CAT. 1 decreases. An explanation for this is that, during the erosion of the clay sample, more turbulence develops in the flow, leading to more erosion. The same turbulence can also occur with Trisoplast. However, this turbulence has a lesser effect on the Trisoplast sample than on the clay sample. Thus, in this situation, it can be concluded that Trisoplast is more erosion-resistant than both clay CAT. 1 and clay CAT. 2 during the longitudinal flow tests.

Results of wave loading tests: Trisoplast

Similar to the longitudinal flow tests, a large amount of the total eroded material was washed away during the first hour of the tests. The explanation for this is also that the loose particles that were washed away were not well adhered to the Trisoplast sample.

The results of the tests with Trisoplast are shown in Figure 11. The results in the graph show that the longer the tests lasted, the less additional material eroded. An explanation for this is that the bentonite-polymer threads only form when erosion begins to occur. Additionally, these tests do not have a constant load, such as the flow in the longitudinal flow tests, on the samples. The wave loading that impacts the samples is more of a dynamic load, allowing the bentonite-polymer threads to remain more intact. This could result in less erosion of the material.

FIGURE 11

Data point erosion Trisoplast during wave loading tests.

Results of wave loading tests: clay CAT. 1

One of the clay samples of CAT. 1 exhibited significantly more erosion during test 2 than the other clay samples (including the clay samples of CAT. 2). For this reason, this clay sample was also reclassified. The reclassification showed that the liquid limit of the clay sample was 44.65%. According to the standard plasticity chart, clay CAT. 1 must have a liquid limit of at least 45%. Since the liquid limit of this clay sample was below 45% (and therefore does not meet CAT. 1 standards) and the results deviated substantially from the other obtained results, it was decided not to include the data points from test 2 of clay CAT. 1 in the results.

During the tests, it is noted that in the first clay sample, most of the erosion occurred at the edges of the sample and at the hole made in the surface. This may be because the clay sample does not have a smooth surface, causing turbulence in the water. This turbulence results in more erosion of the material, which was also visible in test 2. As mentioned earlier, the data points from test 2 of clay CAT. 1 were not included in Figure 12. The clay sample in this test showed substantially more erosion than the clay sample in test 1. An explanation for this phenomenon can be that during test 2, the clay sample was positioned on the side where the metal rod is attached to the flume.

FIGURE 12

Data points erosion clay CAT.1 during wave loading tests.

FIGURE 13

Clay CAT. 1 sample during test 1.

This rod caused more turbulence on top of the wave loading, resulting in a hole in the clay sample as shown in Figure 13. According to the theory of Pilarczyk, turbulence has a significant effect on stability, leading to increased erosion in the clay sample (Pilarczyk and Breteler, 1988).

Results of wave loading tests: clay CAT. 2

Figure 14 shows the results of the wave loading tests with clay CAT. 2. This graph shows that erosion increases with each measurement point. This occurs with 0.0003 to 0.0007 kg per time interval. During these tests, most of the material eroded at the edges of the clay sample and at the hole made in the sample. Similar to the Trisoplast and clay CAT. 1 samples, turbulence in the water is caused by the hole. However, it can be concluded that both Trisoplast and clay CAT. 1 are more resistant to this turbulence than clay CAT. 2.

FIGURE 14

Data point erosion clay CAT. 2 during wave loading tests.

Comparison of different materials: 9 longitudinal flow tests

Similar to the longitudinal flow tests, the different materials were compared for the wave loading tests. For this comparison, the test with the most eroded material for Trisoplast was chosen, while for clay CAT. 2, the test with the least amount of erosion was selected. By comparing the results in this way, the comparison is based on the most unfavourable situation for Trisoplast. Furthermore, for clay CAT. 1, only one data point was obtained, which is also the result used for comparison. Figure 15 presents the comparison of the different materials. The graph shows that the results of the test with clay CAT. 2 shows more erosion than the findings from the clay CAT. 1 sample. For this reason, the following comparison was made, comparing Trisoplast with clay CAT. 1. This was done because the comparison between Trisoplast and clay CAT. 2 gives a favourable result for Trisoplast while looking at the least favourable result for Trisoplast.

FIGURE 15

Data points erosion Trisoplast, clay CAT. 1 and clay CAT. 2 during wave loading tests.

The comparison between Trisoplast and clay CAT. 1 is illustrated in Figure 16. In this graph, with the loading duration of the tests on the horizontal axis and the erosion of Trisoplast relative to clay CAT. 1 on the vertical axis, it can be seen that during the tests with a loading duration of 2 hours, the Trisoplast sample eroded more than the clay sample. As previously mentioned, this phenomenon occurs because all loose particles erode at the beginning of the test. This phenomenon was not observed in the clay sample. As the loading duration increases, it can be seen that Trisoplast erodes less relative to clay CAT. 1. For example, with a loading duration of 4 hours, the erosion of Trisoplast and clay CAT. 1 is equal, and with loading durations of 6 and 8 hours, Trisoplast eroded less compared to clay CAT. 1.

FIGURE 16

The ratio of erosion of Trisoplast relative to clay CAT. 1 during wave loading tests.

By comparing the results in this graph, it may appear that the Trisoplast sample is less erosion-resistant during the test with a loading duration of 2 hours. However, the washing away of loose particles from the Trisoplast sample cannot be included in the erosion, as these particles wash away at the first contact with water. Therefore, the comparison between the erosion of Trisoplast and clay CAT. 1 represented in Figure 16, is less favourable for Trisoplast than it actually is. Since the results of the wave loading are cumulative, all values in this graph should be adjusted downward. However, the factor by which this should be done has not been examined. Despite the fact that this factor has not been examined and applied to the results in the graph, it can still be concluded that Trisoplast is more erosion-resistant than clay CAT. 1 after a loading duration of 4 hours.

Conclusion

During the longitudinal flow tests, the degree of erosion of Trisoplast and clay CAT. 1 and CAT. 2 was investigated. Various tests were conducted with loading durations ranging from 2 hours to 8 hours with time intervals of 2 hours, each test starting with a new sample. Clay CAT. 2 was also tested under longitudinal flow, but for this material, only the 6-hour tests were conducted. The results of the erosion that occurred during the tests are:

  • For Trisoplast, a minimum of 0.0005 kg after 2 hours to a maximum of 0.0016 kg after 8 hours;
  • For clay CAT. 1, a minimum of 0.0013 kg after 2 hours to a maximum of 0.0369 kg after 8 hours; and
  • For clay CAT. 2, a minimum of 0.1507 kg and a maximum of 0.1597 kg, both after 6 hours.

To measure the degree of erosion that Trisoplast, clay CAT. 1, and clay CAT. 2 experience during wave loading, various tests were conducted with loading durations ranging from 2 hours to 8 hours with time intervals of 2 hours, similar to the longitudinal flow tests. However, in the wave loading tests, a new sample is not used for each test; instead, the sample is placed back in the setup after each measurement. As a result, the results obtained from these tests are cumulative.

  • For Trisoplast, a minimum of 0.0006 kg after 2 hours to a maximum of 0.0012 kg after 8 hours;
  • For clay CAT. 1, a minimum of 0.0005 kg after 2 hours to a maximum of 0.0017 kg after 8 hours; and
  • For clay CAT. 2, a minimum of 0.007 kg after 2 hours to a maximum of 0.0021 kg after 8 hours.

For this research, the main question was “Can Trisoplast also be used in dykes in the Netherlands?” To answer this question, Figure 17 shows the ratio of the erosion of Trisoplast relative to clay CAT. 1. Despite the fact that both Trisoplast and clay CAT. 1 were tested under the same loading conditions in the longitudinal flow tests, where turbulence in the flow was created for both materials, this graph shows that Trisoplast erodes less compared to clay CAT. 1.

FIGURE 17

The ratio of erosion of Trisoplast relative to clay CAT. 1 during longitudinal flow tests and wave loading tests.

In the wave loading tests, the erosion of Trisoplast in the 2-hour test is higher compared to clay CAT. 1. This phenomenon is a result of the erosion of loose particles from the Trisoplast sample. As the tests have longer loading durations, it can be seen that Trisoplast erodes less compared to clay CAT. 1 under the same load. By analysing the results illustrated in the graph below, it can be concluded that Trisoplast is more erosion- resistant than clay CAT. 1, making it promising to conduct further research on the application of Trisoplast as a sealing layer in dykes.

Discussion

In the present study, the difference in erodibility between Trisoplast and clay during longitudinal flow tests and wave loading tests was investigated, with all tests conducted in duplicate. However, tests conducted in duplicate do not provide sufficient reliability to definitively determine whether Trisoplast is a suitable alternative as a sealing layer in dykes

To compare the findings from this study with previously obtained results, similar studies were reviewed. For the longitudinal flow tests with Trisoplast, a study was found where the results showed more erosion than the findings in this report. The reason for this difference cannot be explained, as both studies used the same preparation. However, a different test setup was used in both studies, which may explain the difference in erosion. Additionally, a different clay density may have been assumed in both studies. This report found that the density for clay and clay CAT. 2 differs from values in the literature. This difference cannot currently be explained but may have an impact on the erosion.

Furthermore, the erosion of Trisoplast in both the longitudinal flow tests and wave loading tests, with a loading duration of 2 hours, is relatively high compared to the erosion that occurs with a loading duration of 8 hours. This phenomenon causes Trisoplast to exhibit more erosion than clay in the wave loading tests with a shorter loading duration.

Results showed Trisoplast is more erosion-resistant than clay.

The moisture content of the samples was determined before and after each test. During the determination of the moisture content, the maximum difference for clay was measured at 1.3% (for CAT. 2), and for Trisoplast, this difference was 0.5%. This may have an impact on the results obtained in this study.

Additionally, some clay samples in this study were reclassified after exhibiting abnormal behaviour during the tests. This reclassification revealed that not all clay samples were correctly classified. This may be due to the fact that the clay was delivered in different bags, not all of which were classified. As a result, it is possible that the clay samples that were not reclassified were incorrectly classified, which means that the measured results may not belong to the correct erosion class.

Finally, to date, no fixed value is known for when clay erosion classes begin to erode. Clay is classified into CAT. 1, CAT. 2, or CAT. 3 based on the liquid limit, sand content and plasticity index. This classification does not take into account the loading conditions that the different erosion classes can withstand before erosion occurs.

Recommendations

For this research, it is essential to collect sufficient data on the erodibility of Trisoplast and clay. With this data, it can be advised in the future whether Trisoplast is a suitable alternative to clay as a sealing layer in dykes. In the present study, it was concluded that Trisoplast is potentially promising for further research, with several improvements to be considered.

The tests conducted in this study should be repeated multiple times to increase the reliability of the results. The same preparation and test setup should be used. By consistently using the same method, the results can be better compared, enabling the potential application of statistics. It is also relevant to rinse the samples with a very low flow rate before conducting tests with Trisoplast. This way, all loose particles are washed away, which may yield more favourable results for Trisoplast in the 2-hour duration tests.

In addition to repeating the tests under the same loading conditions as in this study, new tests should be conducted with different parameters. Consider longer loading durations, higher flow velocities in the longitudinal flow tests, or higher waves in the wave loading tests. These tests can provide more insight into the erodibility of Trisoplast compared to clay. Furthermore, the influence of increasing moisture content should be taken into account during the analysis of the results. The density of the clay used for the tests should also be considered.

Before conducting these tests, it is advisable to classify all samples to be tested beforehand. This can reduce anomalous results by clearly identifying which erosion class of clay is being tested. It also ensures more consistency and comparability of the results. Additionally, for future research, it is efficient to establish a fixed value for the loading conditions that the clay samples can withstand before erosion occurs. This allows for more targeted and consistent testing.

Lian Schout receiving the 2024 Waterbouwprijs (Hydraulic Engineering Prize) for her graduation assignment.

Summary

Due to the large number of dykes in the Netherlands, it is becoming increasingly difficult to find enough clay that meets the required quality standards. Therefore, an alternative is being researched for the use of clay as a sealing layer on dykes, specifically Trisoplast. Trisoplast is comprised of a specialised clay-polymer component combined with a mineral filler, with sand being particularly suitable for this purpose. The main question of this research is whether Trisoplast can also be used in dykes in the Netherlands. To answer this question Trisoplast and clay CAT. 1 and 2, were tested in Rotterdam’s University of Applied Sciences’ aqualab. Here, longitudinal flow and wave loading tests were conducted. Results showed Trisoplast eroded only 4.7% of the amount eroded by clay CAT. 1 in longitudinal flow tests and 71% in wave loading tests. Trisoplast is more erosion-resistant than clay, warranting further investigation for use in dykes.

Author

Lian Schout

Lian, a graduate of the Rotterdam University of Applied Sciences, won the 2024 Waterbouwprijs (Hydraulic Engineering Prize) in the HBO category with her graduation project with supervision from Antea Group and Tritech Solutions. She is currently working as a junior project engineer at Boskalis Nederland on a project called Meanderende Maas, which is a reinforcement of a dyke near the Maas, between Ravenstein and Lith.

OTHER ARTICLES BY THIS AUTHOR

PDF download

Download the PDF version of this article with high resolution pictures and layout.

Single-page view

DOWNLOAD PDF Document | 53,5 MB

Two-page view

DOWNLOAD PDF Document | 1,37 MB

Share this page